The rounded turquoise lines on this map of tributaries to the Wachusett Reservoir depict one of the most fundamental workflows in all of computer cartography: the buffer analysis. In making this map, analysts at MassGIS wanted to understand the different types of land use within certain buffer distances of tributaries to the reservoir. If heavy industrial activities like construction, excavation, and paving took place within 400 feet of key tributaries, millions of people would feel the downstream consequences.
Using geographic information systems (GIS) software, analysts created data layers highlighting areas within 200 and 400 feet around the tributaries. This would allow them to assess how land use controls like conservation easements overlapped with the buffered tributaries. In this regard, the map itself is less important than the statistical values printed to its right: “Percent of both buffers that remains to be Protected.”
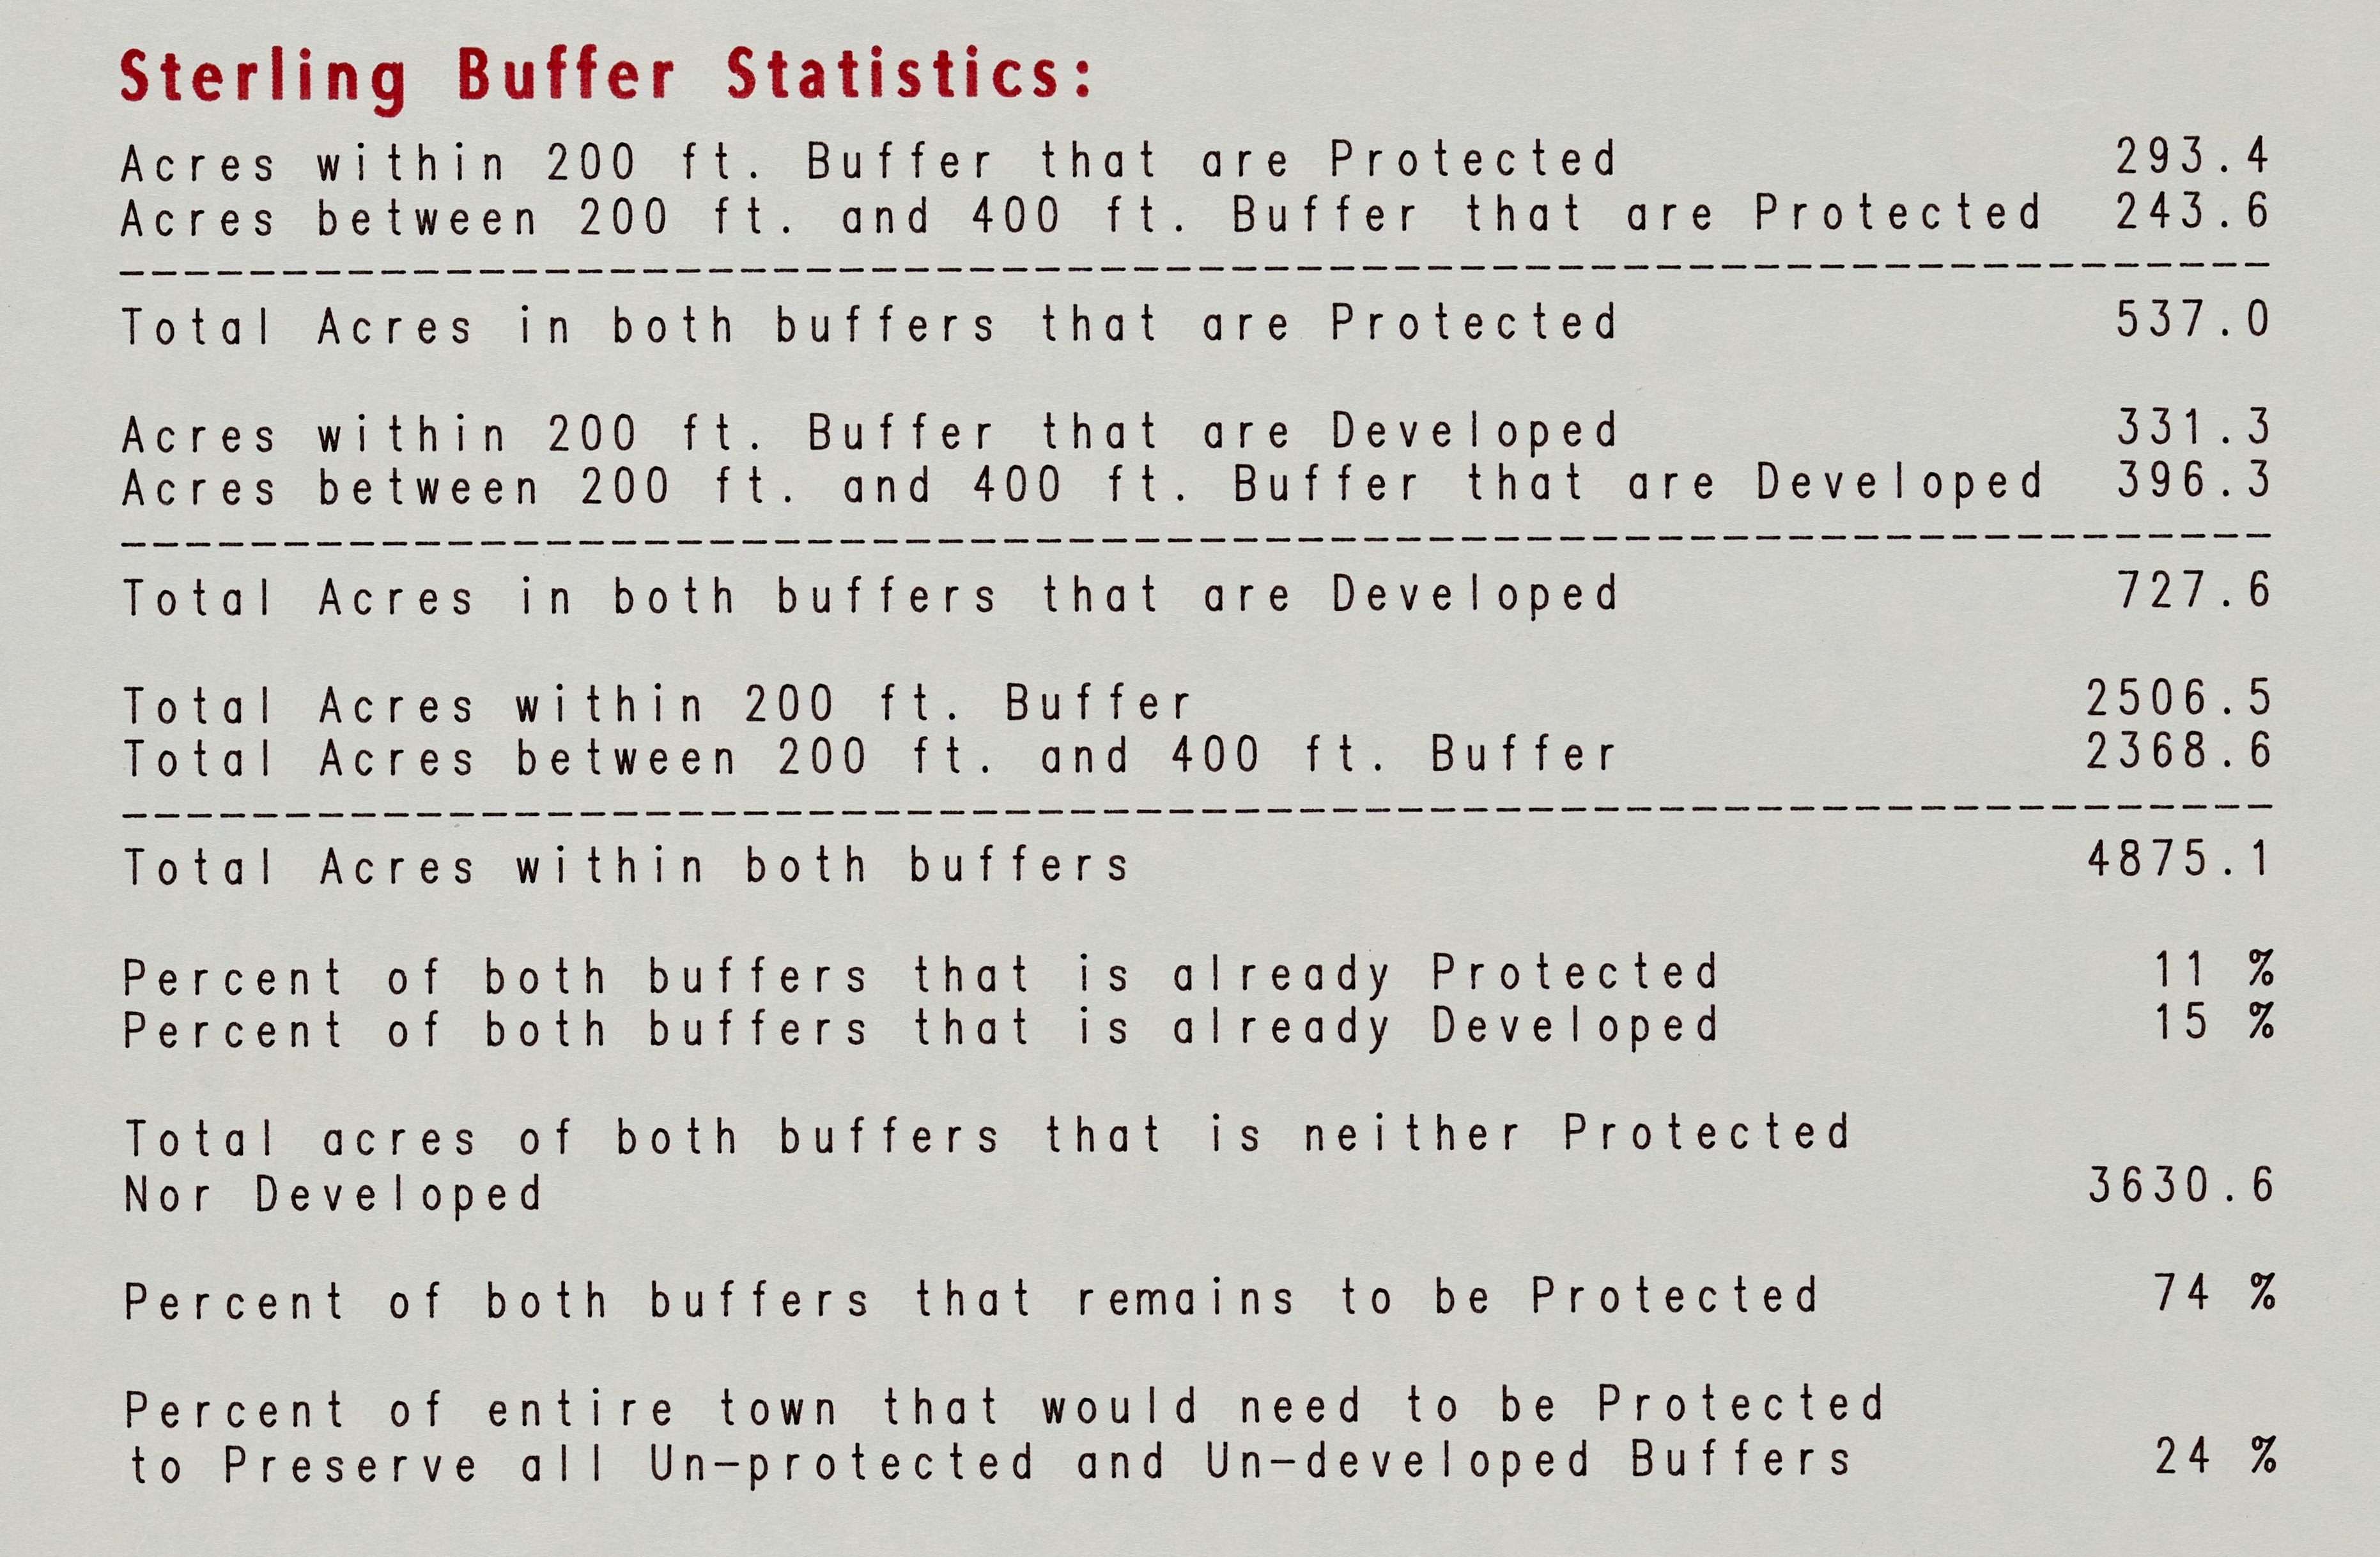
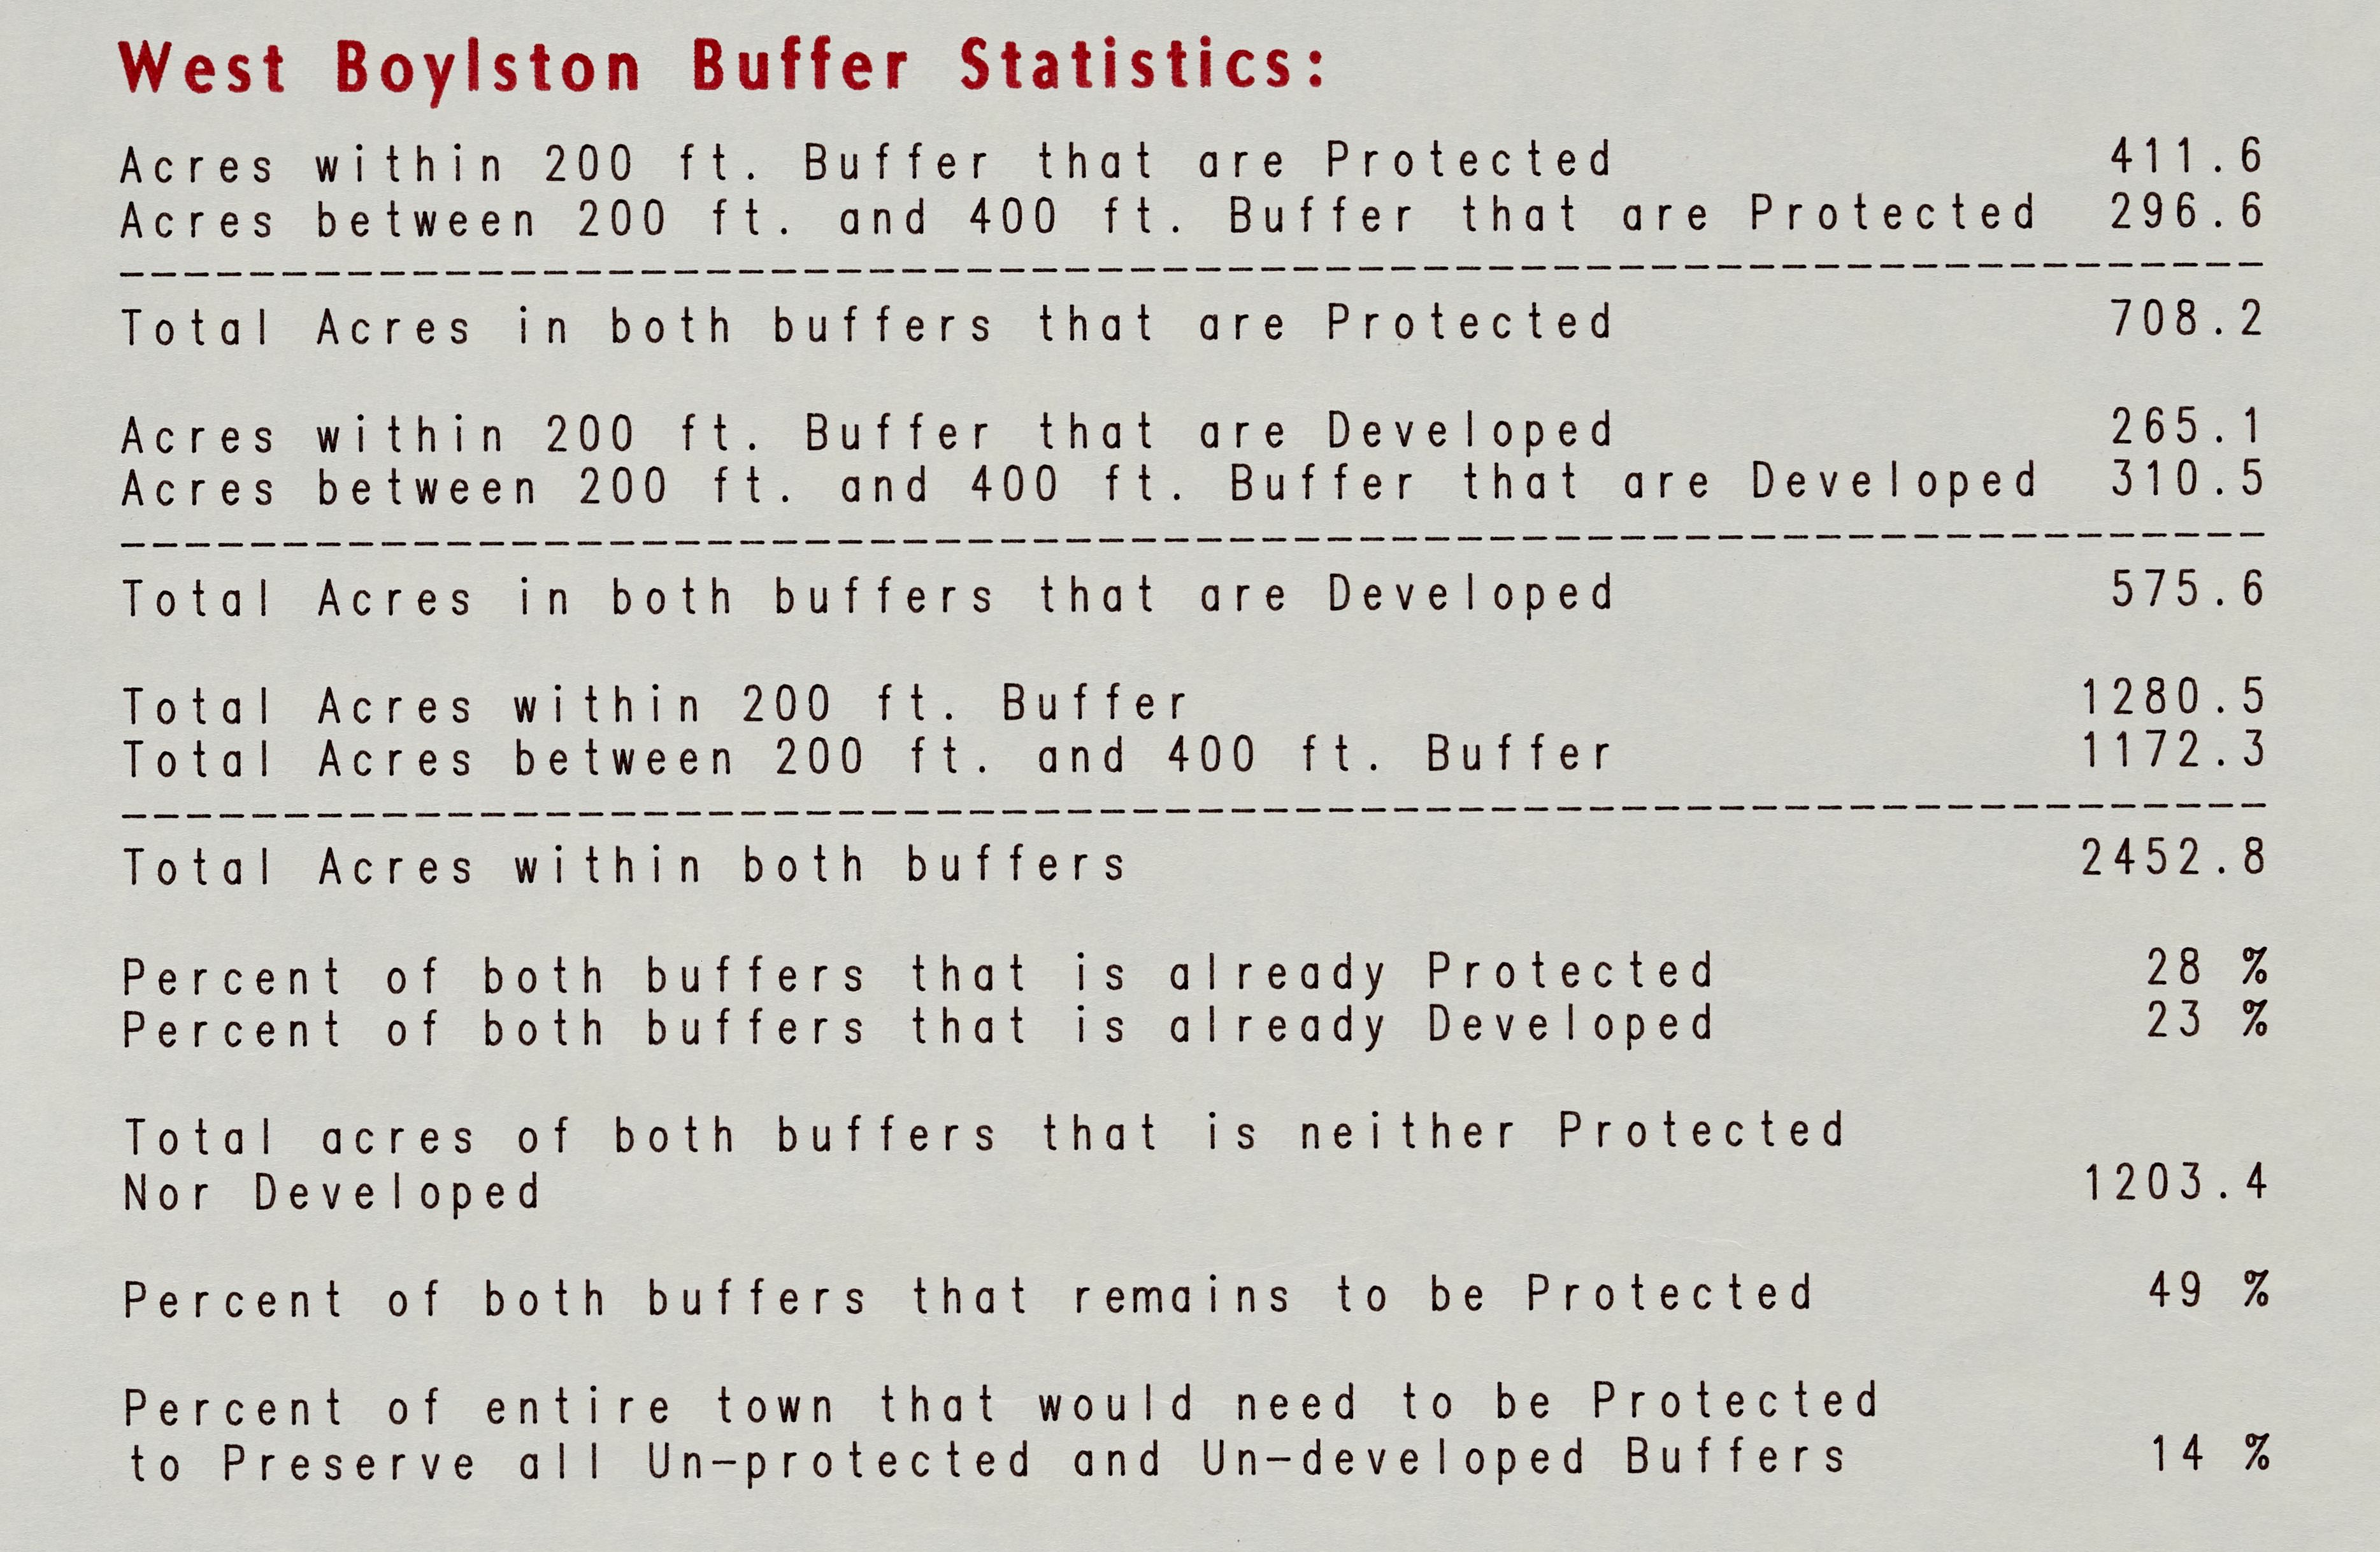
Those numbers—74% in Sterling and 49% in West Boylston—describe the percentage of land near tributaries that had not yet been secured with environmental protections. This analysis helped inform policies that still govern water use today, in the form of the 1992 Massachusetts Watershed Protection Act.