The term “noisy data” usually refers to unwanted, irrelevant, or otherwise corrupt information in a dataset. For mapmakers, separating the signal from the noise is a fundamental part of the analytic and cartographic process. However, when trying to map something like noise pollution—or unwanted and excessively loud sounds in a particular environment—“noisy data” takes on an entirely different meaning.

Our visualization of the DOT’s transportation noise map, focused on the Greater Boston region.
“The Sound of Mass Transit,” featured in our exhibition More or Less in Common, is our own original visualization of data from the US Department of Transportation’s National Transportation Noise Map. Boston is a particularly noisy place, as WGBH reported in 2019, and sometimes the “symphony of the city” can become unbearable. To combat noise pollution, the City of Boston’s Municipal Code sets rules against “unreasonable” levels of noise, prohibiting anything louder than 50 decibels from 11pm to 7am, or anything louder than 70 decibels at any time, except for permitted construction.
Created by estimating noise levels based on factors like road type or airport proximity—rather than, for example, standing on the every sidewalk in America with a decibel reader—the noise map helps visualize which areas in the Greater Boston region suffer from noise pollution. However, as we considered the DOT’s methodology in creating the dataset, we also started to wonder what kinds of context we could add to help understand where the most severe effects of noise pollution are felt.
If a tree falls in the forest…

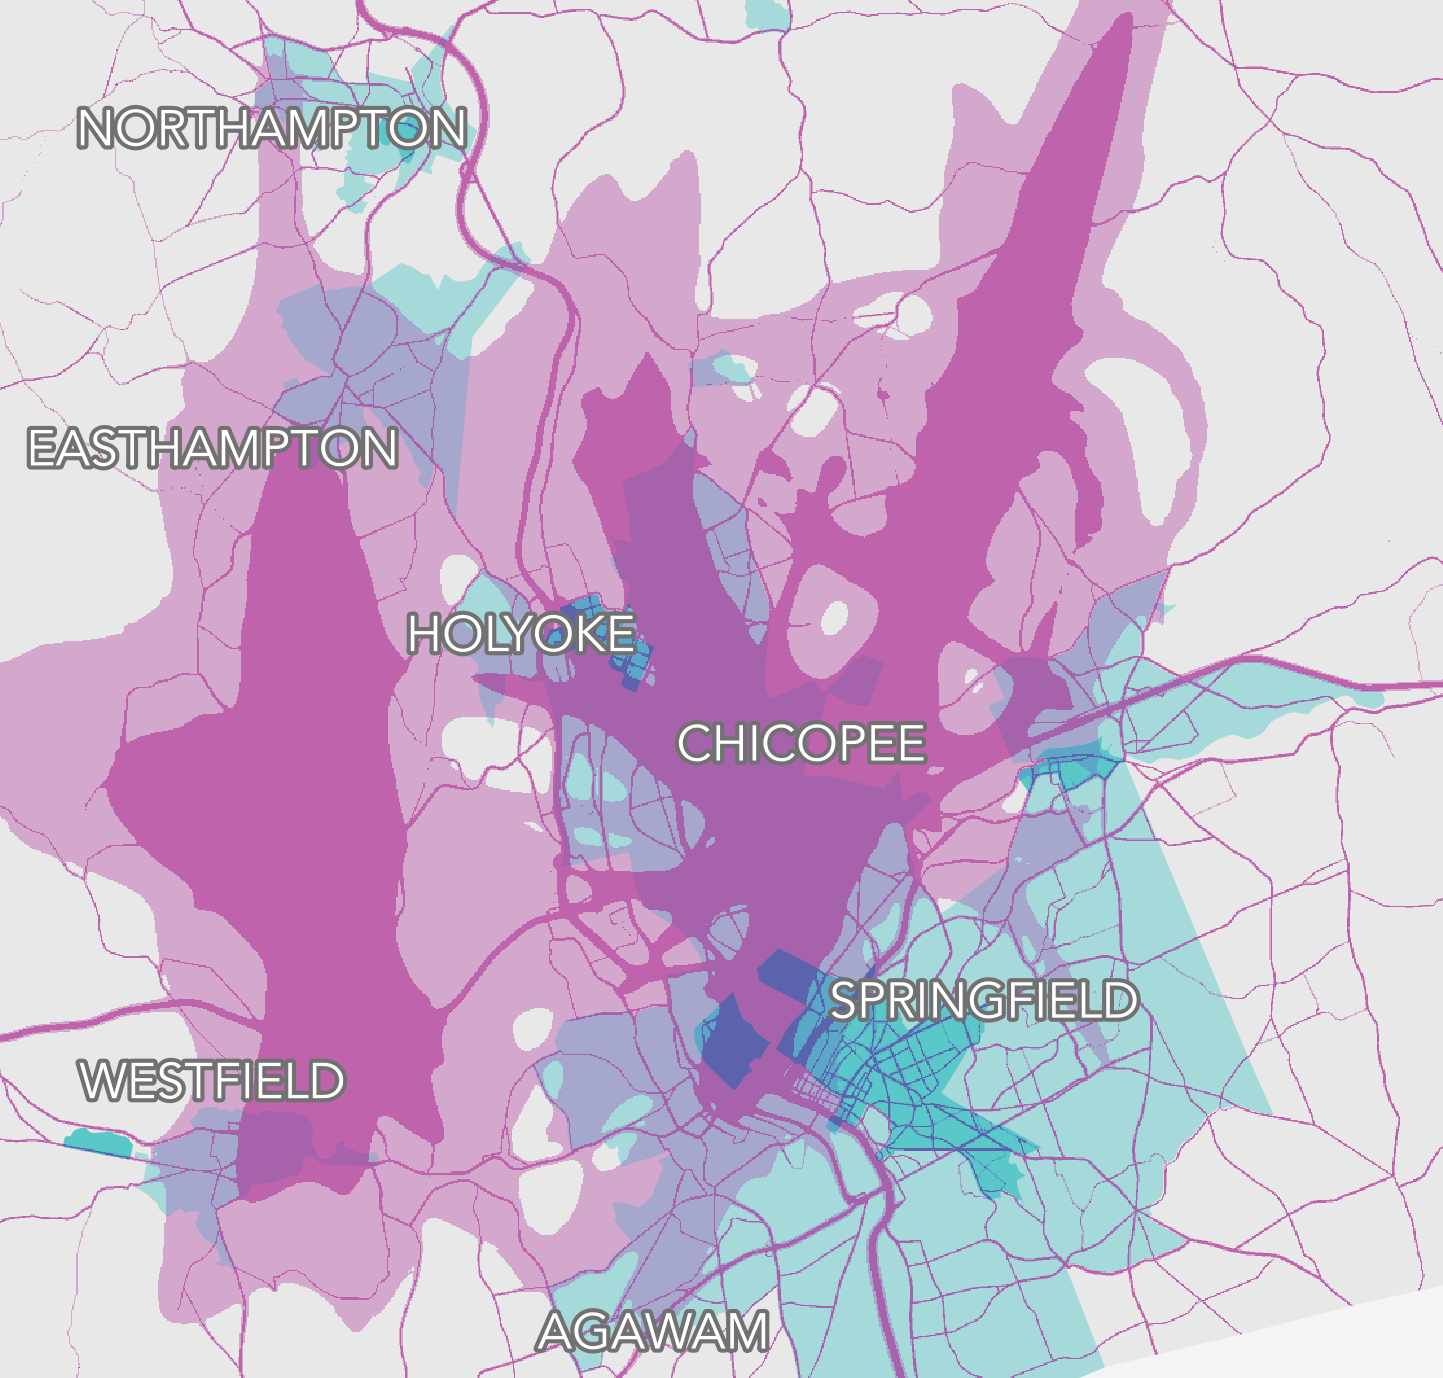
Our bivariate noise map for Massachussetts, taking population into account.
There are two ways to make something louder: increase the number of decibels, or increase the number of ears. Across the municipalities of Massachusetts, how many places exist where there’s both a good deal of noise pollution and plenty of people to hear it? In order to determine where the noisiest noise intersects with the most people (and vice versa), our bivariate map overlays the noise data with population data at the Census tract level from 2020.


Some notes on interpreting the map: only areas that rank 45 decibels or higher appear in color. Pink indicates loud places with very few people, while turquoise represents dense populations and environments that experience medium noise pollution, just over 45 decibels. By contrast, the areas on the map shaded dark purple have extremely high levels of noise poollution and dense populations.
One thing the map highlights is that not all highways are created equally noisy. There’s no doubt that across the commonwealth, highways are loud—but their volume has different impacts depending on their location. Notice that in the DOT’s noise map, most highways are categorized into roughly the same class: a dark purple that matches the starburst of Logan Airport. When overlaid with population data, however, you can actually separate highways into several categories, drawing a distinction between highways that run through largely unpopulated areas and those which travel a route cutting through dense areas. It’s particularly easy to see this in the zoomed in view of Boston, where violet highways appear in the places where many residents neighbor the highway’s noisy corridor.
Panning over to Westfield, Chicopee, and Springfield, we find a number of noisy areas caused by airports, including the Westfield-Barnes Regional Airport, the Westover Airport, and the Baystate Medical Center Heliport. Much of this area is pink, covering thinly populated areas, though sections of the densely populated core area of these three cities appears violet and purple. By contrast, the much larger Logan Airport—with a noise area that includes a lot of unpopulated ocean area— fades into the densely-populated hustle and bustle of Greater Boston. What we take away from this depends on our perspective: we could make an argument that the airfields of western Mass are less invasive because they impact fewer people, just as easily as we could argue that Logan Airport is less invasive since it already exists within the loud urban core. As critical cartographers have long argued, maps don’t just represent the world as it is—they help create it, too.
The forest for the trees
Combining noise data with population density lets us assess transportation volume not only in decibels, but by how many people those decibels affect. Though interesting, and even pretty, these kinds of cartographic visualizations risk missing the forest for the trees. In essence, our map is a spatial version of the old thought experiment, “If a tree falls in the forest, does it make any sound?"—but this experiment ignores that the tree still falls, whether anyone is around to hear it or not. As we point out in More or Less in Common:
Transportation noise is closely linked to transportation exhaust, meaning these communities aren’t just loud—they can also be polluted. Yet these local communities usually have little say over how these national and international pieces of infrastructure are regulated. Meanwhile, affluent suburban communities outside of the urban core tend to be much more insulated from noise pollution.
If there’s one thing that both noise maps show, it’s that the environmental costs of how our built world is designed are high, whether we are looking at airports and arteries or train tracks and railroads. Historic and contemporary cartographic objects can help us make sense of how those costs are not borne equally by its inhabitants, and how noise pollutes even when nobody’s listening.
More or Less in Common: Environment and Justice in the Human Landscape is open through December 28, 2022.
Our articles are always free
You’ll never hit a paywall or be asked to subscribe to read our free articles. No matter who you are, our articles are free to read—in class, at home, on the train, or wherever you like. In fact, you can even reuse them under a Creative Commons CC BY-ND 2.0 license.