On October 11, we hosted From The Vault: Time Travel Back to 1906 Boston.
During this edition of From the Vault, we had the iconic 1906 film Seeing Boston playing in our classroom, accompanied by maps, photos, and other objects from BPL Special Collections that helped animate the places seen in the film. Be sure to read the two accompanying articles: Time Travel Back to 1906 Boston and Riding Around 1906 Boston.
Poole, A. F. Twentieth century Boston (1905)
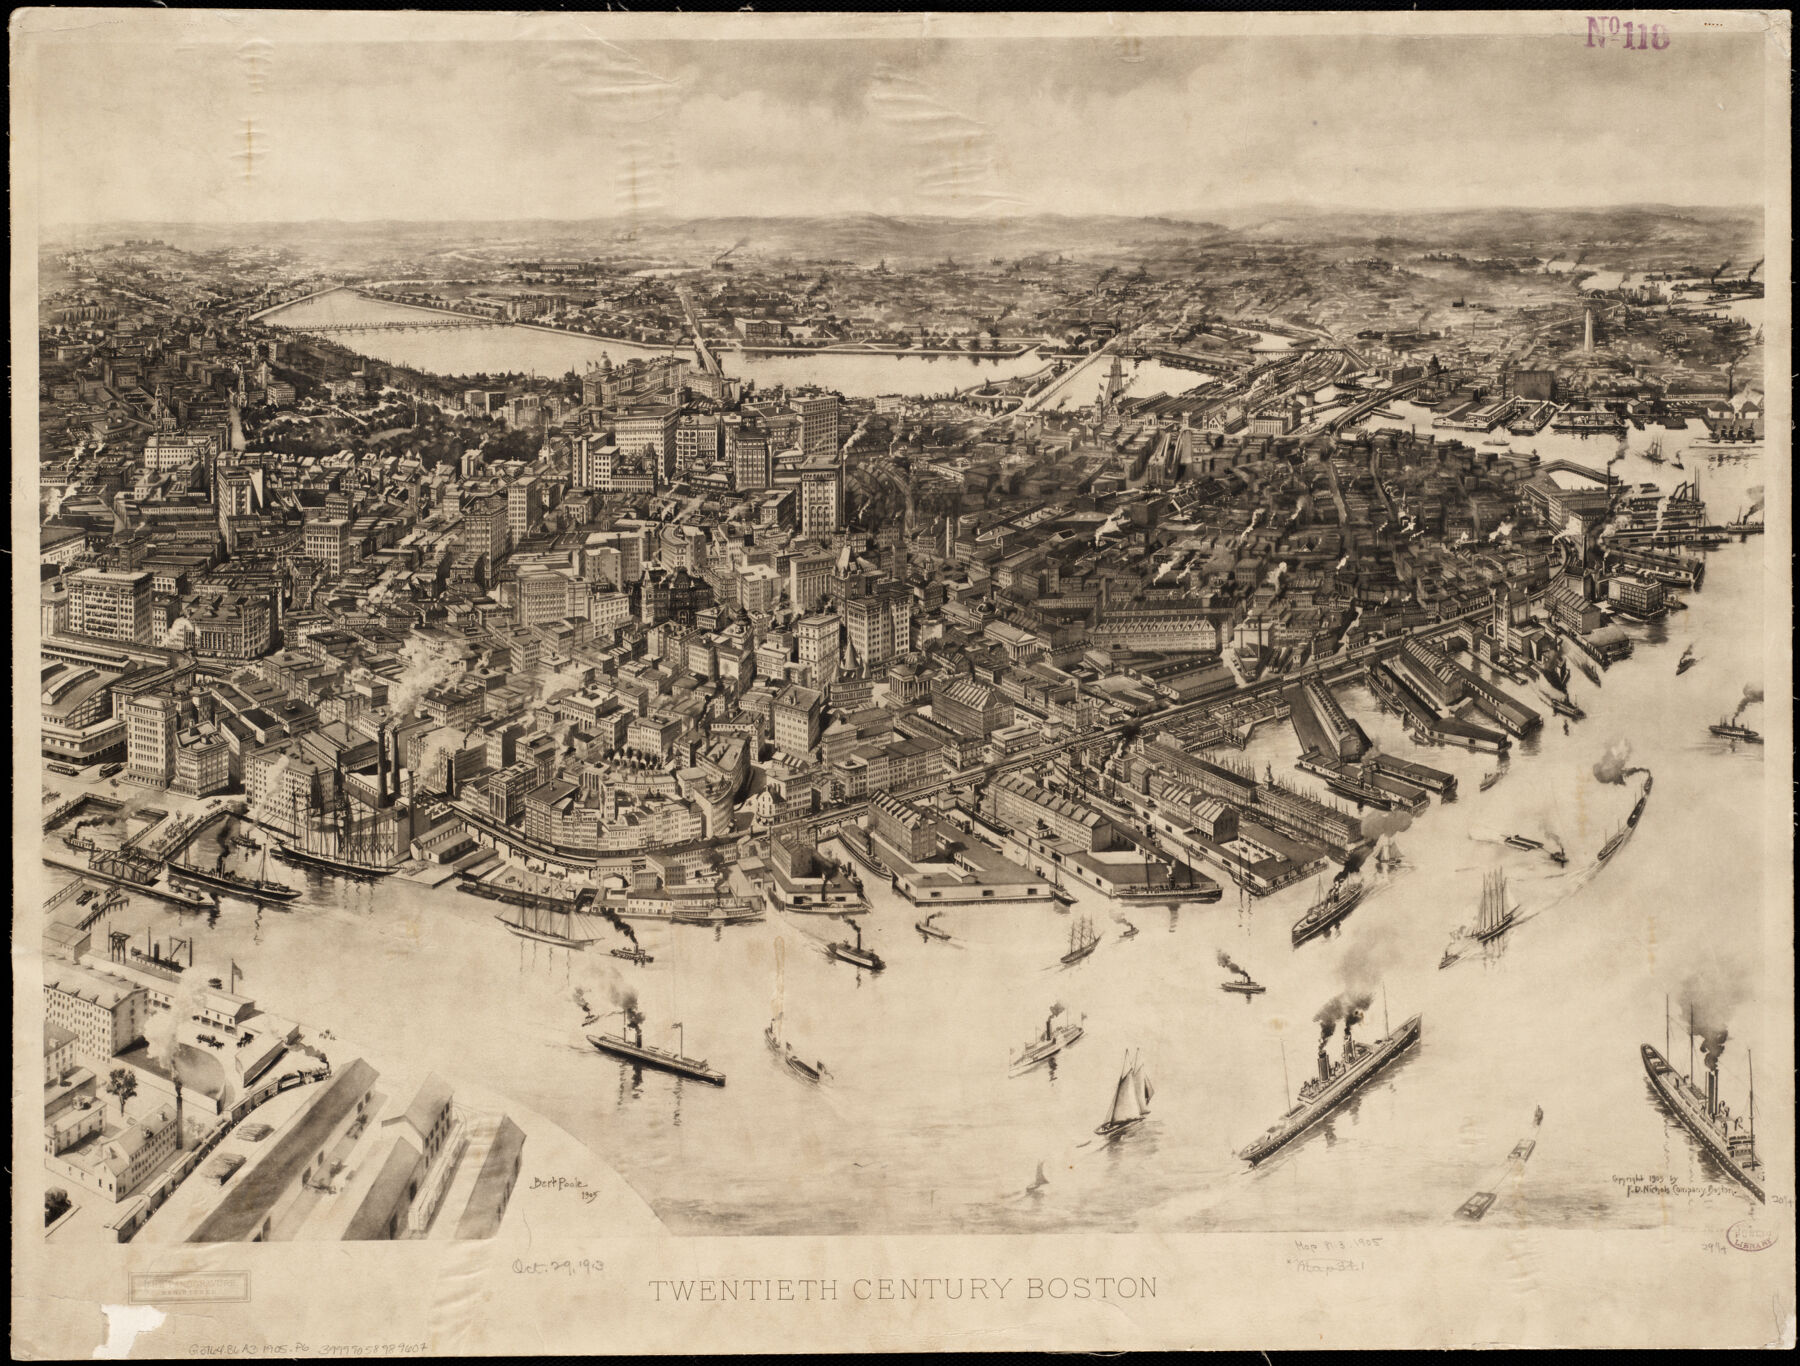
This image shows the “New Boston” of 1905 – a downtown filled with high-rise office and other commercial buildings where shops and homes had stood a few years earlier. The artist who created the map is Albert F. Poole (1853-1934). In addition to bird’s eye views of places throughout New England, he created paintings and served as a newspaper editor.
The image shows Boston as seen from the East and clearly depicts the clustering of tall, modern buildings in the central business district. At the bottom left we see South Station, and the warehouses and manufacturing buildings constructed after the fire of 1872.
Note how the commercial aspects of the city seem to dominate. The Old North Church, then as now considered one of Boston’s signature historic sites, is barely visible at the right, even though its steeple was only a few feet shorter that the Ames Building, then Boston’s tallest. You also have to look closely to spot the gold dome of the State House. In Back Bay, M.I.T. is just one of a row of buildings on Boylston Street, all we see of the then new Boston Public Library is its roof, and the Museum of Fine Arts appears not to be there at all.
This view of Boston was chosen as the central illustration in a 1907 Chamber of Commerce flyer describing Boston as “The Best City in the United States to Live in, to Do Business in, and to Visit.”
Things to Consider:
- What is the cartographer trying to do with this map? Create a record of what the city looked like; make a decorative artwork; convey a message about the city?
- How might a bird’s eye view map created of Boston today be similar to and different from this one?
George W. Bromley and Walter S. Bromley Atlas of the city of Boston : Boston proper and Back Bay : from actual surveys and official plans (1908)

Insurance companies need to be able to assess risk when setting premiums. For urban property insurance, this involves such factors as the proximity of fire houses, roads and water lines to the insured property, together with the type of construction and use of the covered building and its neighbors. This information became increasingly challenging to obtain as insurers extended their underwriting beyond their local communities.
Companies like Bromley filled this need by compiling and publishing atlases with this information, and updating them regularly to keep the information current. One of the earliest U.S. atlases was the Insurance Map of Boston, Volume 1, 1867, by D. A. Sanborn. We tend to think of the economic value of data as a twenty-first century phenomenon, but these atlases show how essential information was to commerce well over a century ago.
The Bromley Atlas seen here provides essential information for following the path of the streetcar in Seeing Boston, including the location of specific buildings, their height and street numbers. The areas seen in Seeing Boston are covered by Plates 1, 6, 11, 12, 19, 20, 21 and 23.
Things to Consider:
- Do you think the people who created these maps would be surprised to learn that historians and others trying to understand their world are looking at their work in the year 2024?
- If you could go back in time, what additional information would you include in these maps to make them more useful to future generations?
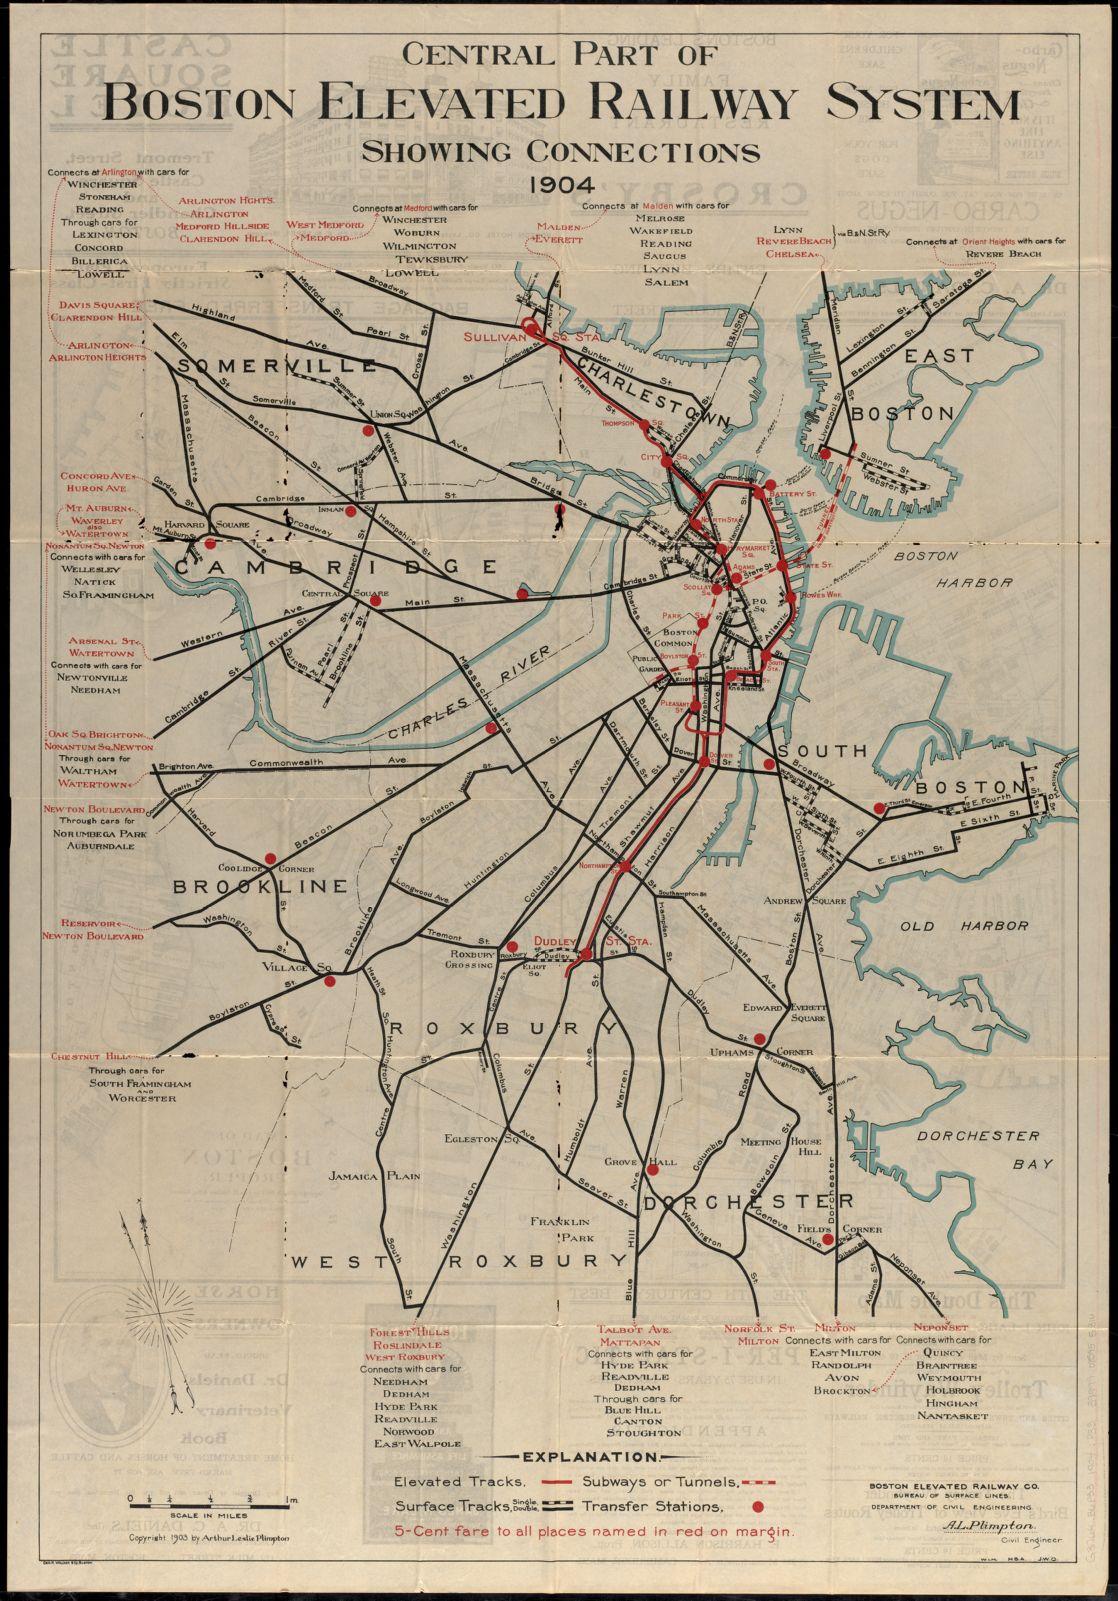
Arthur Leslie Plimpton, John J. Lane, and Geo. H. Walker Central part of Boston Elevated Railway system showing connections (1904)
Front side of map
When Seeing Boston was released in 1906, streetcars were everywhere. There was even a New England Street Railway Club, which published a guide that covered the entire region. It’s said that with a number of transfers and connections one could make it all the way from Boston to New York by streetcar.
The connection notations at the periphery of the map highlight the seamless nature of this network. The end of each line connects to one or more lines serving more distant locations.
The title of this map seems confusing at first since it includes subway and surface streetcar lines as well as elevated trains. But, “Boston Elevated Railway” refers to the name of the private company that ran all services, not to the trains that ran on elevated tracks. Rapid transit in Boston was operated by private businesses until the 1940s.
The reverse of the map gives detailed routes within the city of Boston and enables us to follow the streetcar in Seeing Boston. It’s also interesting to read the advertisements at the top and bottom, including those for a veterinary book on home treatment of horses and cattle, and Dr. Harrison’s Peristaltic Lozenges, that were pleasant tasting and apparently cured everything from appendicitis to pimples and loss of appetite.
Things to Consider:
- Why were streetcars replaced by buses?
- How did the location and extension of streetcar lines influence the development of the Boston region?
Geo. H. Walker & Co. View of Boston freight terminals, the New York, New Haven & Hartford Railroad (1903)
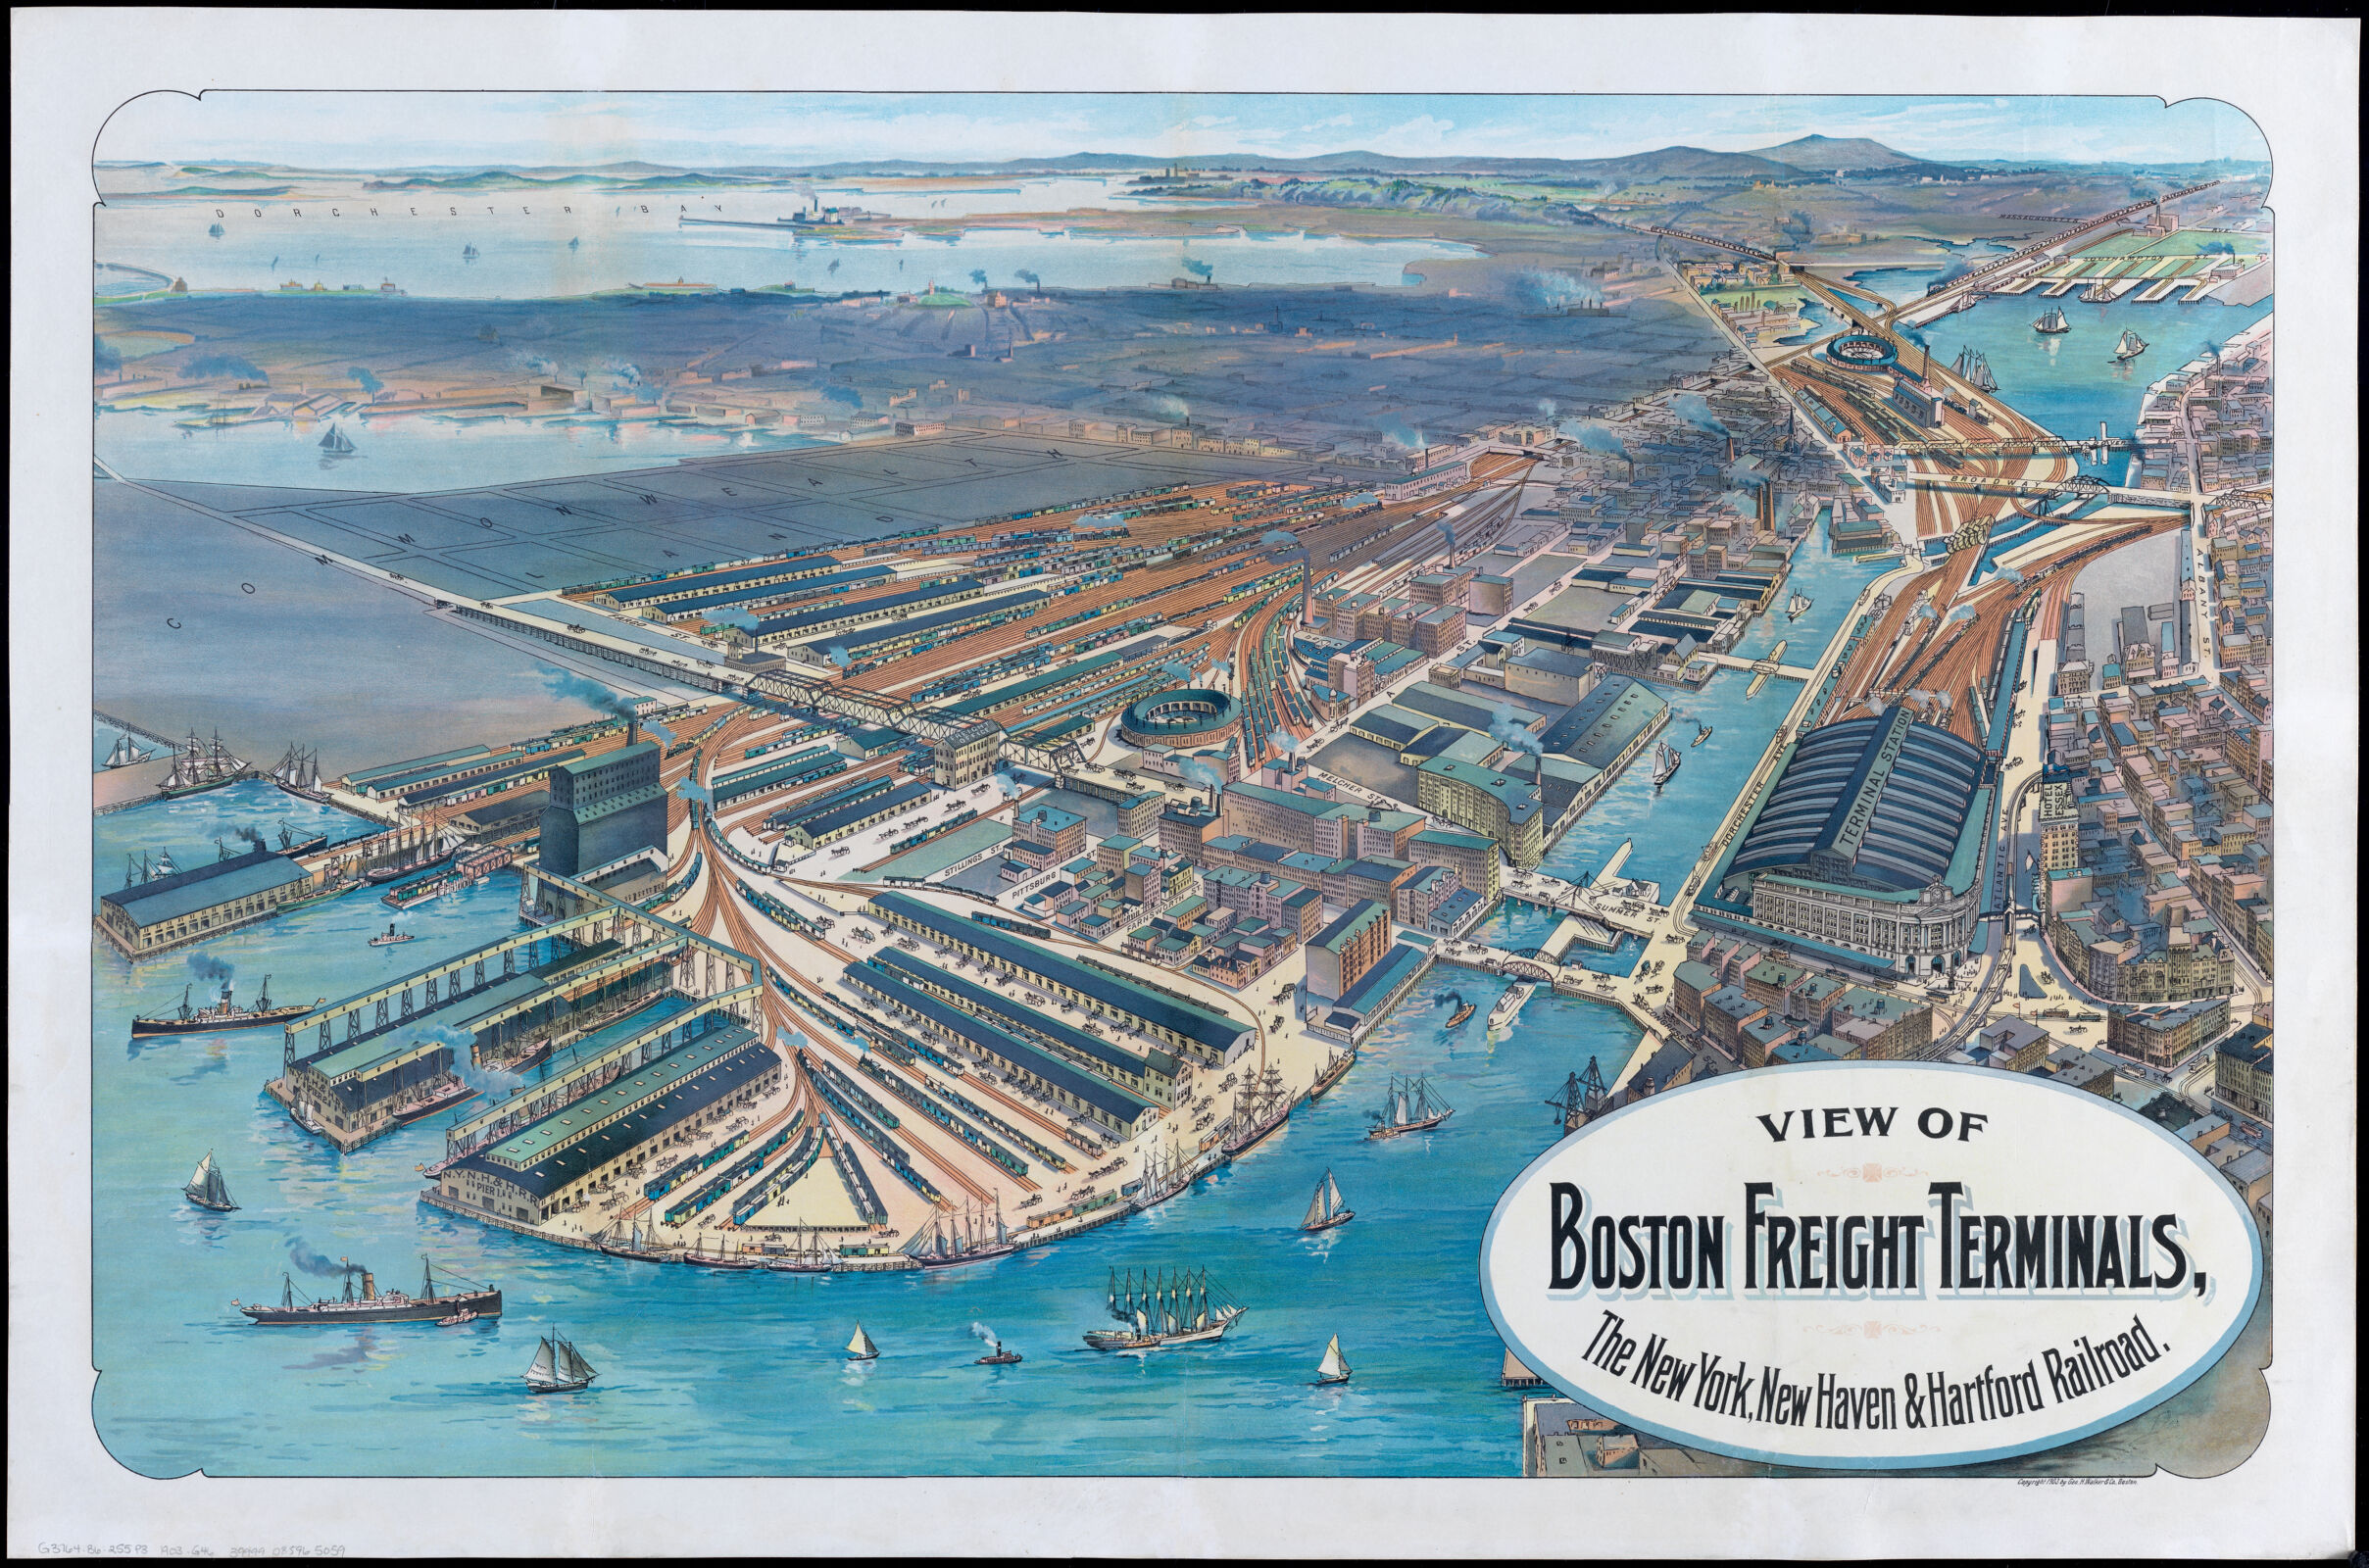
To Bostonians of 1906, it would have been a source of civic pride and promise of prosperity, for the South Station complex was said to be the largest railroad terminal in the United States or the world, depending on the source. This would have been extremely significant at a time when railroads accounted for the preponderance of intercity transport, both passenger and freight. Given the number of competing modes of transport today, it can be difficult for us to appreciate how dependent our ancestors were on railroads.
At the time it opened, the station was called South Union Station, the word “union” indicating that it was served by more than one railroad. For today’s Bostonians, perhaps the most informative thing about this map is that it illustrates why the land at the lower left, site of today’s Federal Courthouse, is called Fan Pier.
Things to Consider:
- How many of the buildings shown in this map are still there today?
- Of the buildings still standing, how many are used for the same purpose as they were in 1906?
- Of the buildings whose use has changed, how many are now used as offices, research facilities, storage, and residences?
Geo. H. Walker & Co Map showing the terminal facilities of Boston (1902)

This map shows the network of highways, rail lines and shipping routes that connected people within Boston, and connected Boston with the rest of the world. The legend lists the steamships lines that served the Port of Boston, and the destinations that each line served.
The importance of these facilities at the time may not be immediately apparent in 2024 since manufacturing and industry are not central to Boston’s economy today. But they were in the early twentieth century. In 1907, Boston’s Publicity and Information Bureau issued a circular stating that the region had 3000 manufacturing establishments, and had among the world’s largest facilities for boot and shoe making, watch making, production of shoe machinery, and manufacturing electrical apparatus.
Boston’s concern with transportation was not limited to the movement of people on rapid transit lines, but extended to freight and commercial shipping as well. In the 1890s the Commonwealth created a State Board on Docks and Terminal Facilities to examine conditions in the Port of Boston and make recommendations for their improvement. The Board’s report included a map similar to this one. It appears that updated Terminal Facility maps were issued every few years.
Things to Consider:
- What are some of the ways in which this map might have been used when it was first published?
- Notice how much of the land area is devoted to transportation, especially railway facilities.
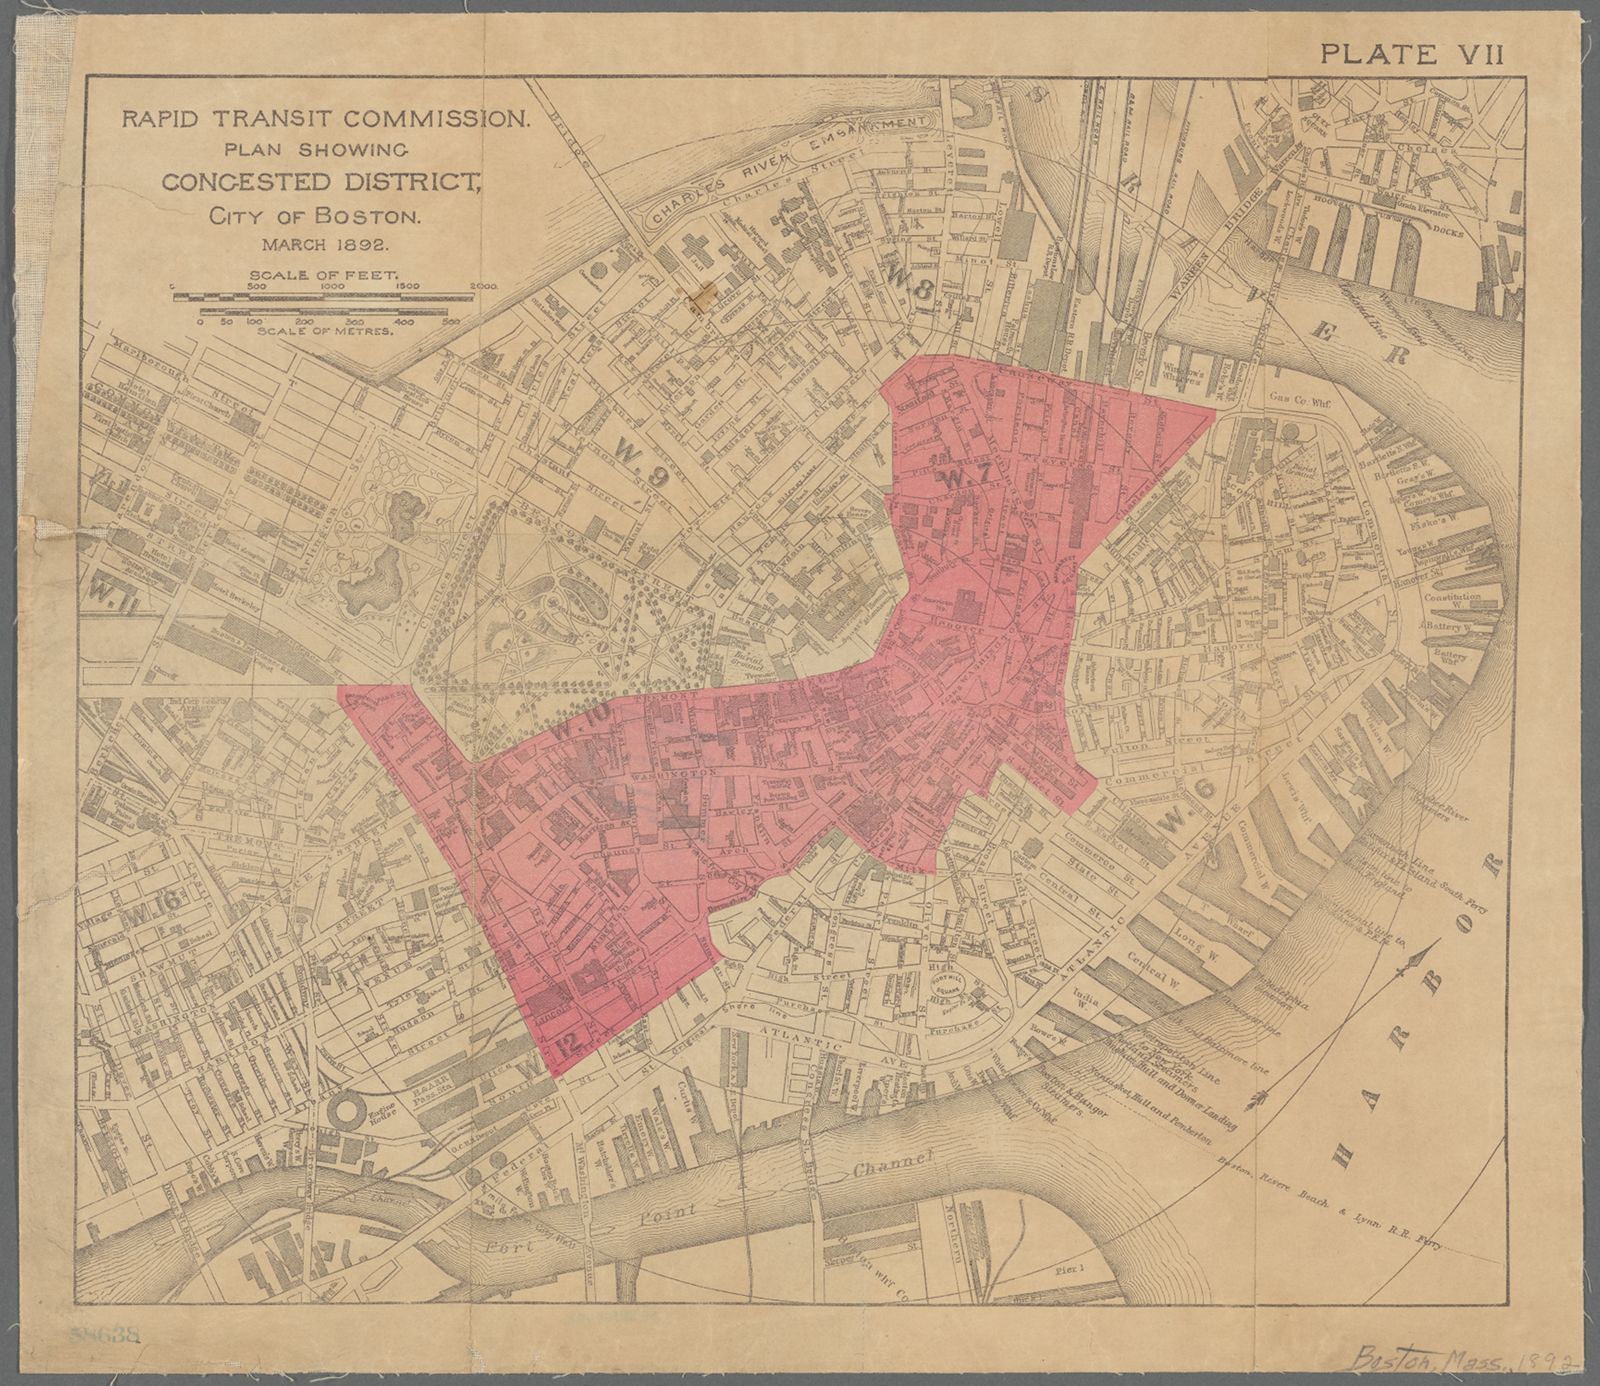
Rapid Transit Commission Rapid Transit Commission, plan showing congested district, city of Boston, March 1892 (1892)
Traffic congestion seems to be a perennial problem in Boston – not many years ago there was much discussion about how the “Big Dig” would solve our problems. Today there are complaints about a faltering rapid transit system.
The area highlighted in pink was designated the Congested District within which traffic problems were most acute. All the streets shown in Seeing Boston prior to M.I.T. are within this district.
Our ancestors seem to have had trouble getting around as well. It was said that the situation on Tremont Street was so bad in the late 1800s that one could get from Park to Boylston Street more quickly walking on the roofs of the stalled streetcars than riding on the seats within them. The city and state combined to create a commission to study the problem and come up with a plan for creating a rapid transit system for Boston and its suburbs. This map was part of the commission’s report.
Things to Consider:
- To what extent does the street behavior of drivers and pedestrians seen in Seeing Boston contribute to traffic problems?
- The Rapid Transit Commission’s plan called for the construction of both subways and elevated rail lines. Today only the subway remains. Were the elevated trains a bad idea? Could their shortcomings have been foreseen? What can we learn from their demise?
Our articles are always free
You’ll never hit a paywall or be asked to subscribe to read our free articles. No matter who you are, our articles are free to read—in class, at home, on the train, or wherever you like. In fact, you can even reuse them under a Creative Commons CC BY-ND 2.0 license.