On March 7, we hosted From The Vault: Mapped By Her -The Uncharted Influence of Women in Cartography
Women have always been a part of charting the Earth throughout history.
Histories of map-making generally emphasize the role of men; however, since the advent of the printed map, women have worked as colorists, engravers, shop owners, publishers, and, most importantly, as map-makers themselves.
This selection of maps was intended to help visitors encounter works by female map creators, designers and educators, learn about the various cartographic skills employed by women over the centuries, and observe the transition of women in cartography from marginalized to celebrated.
Eliza Tileston, Map of Massachusetts (1819)
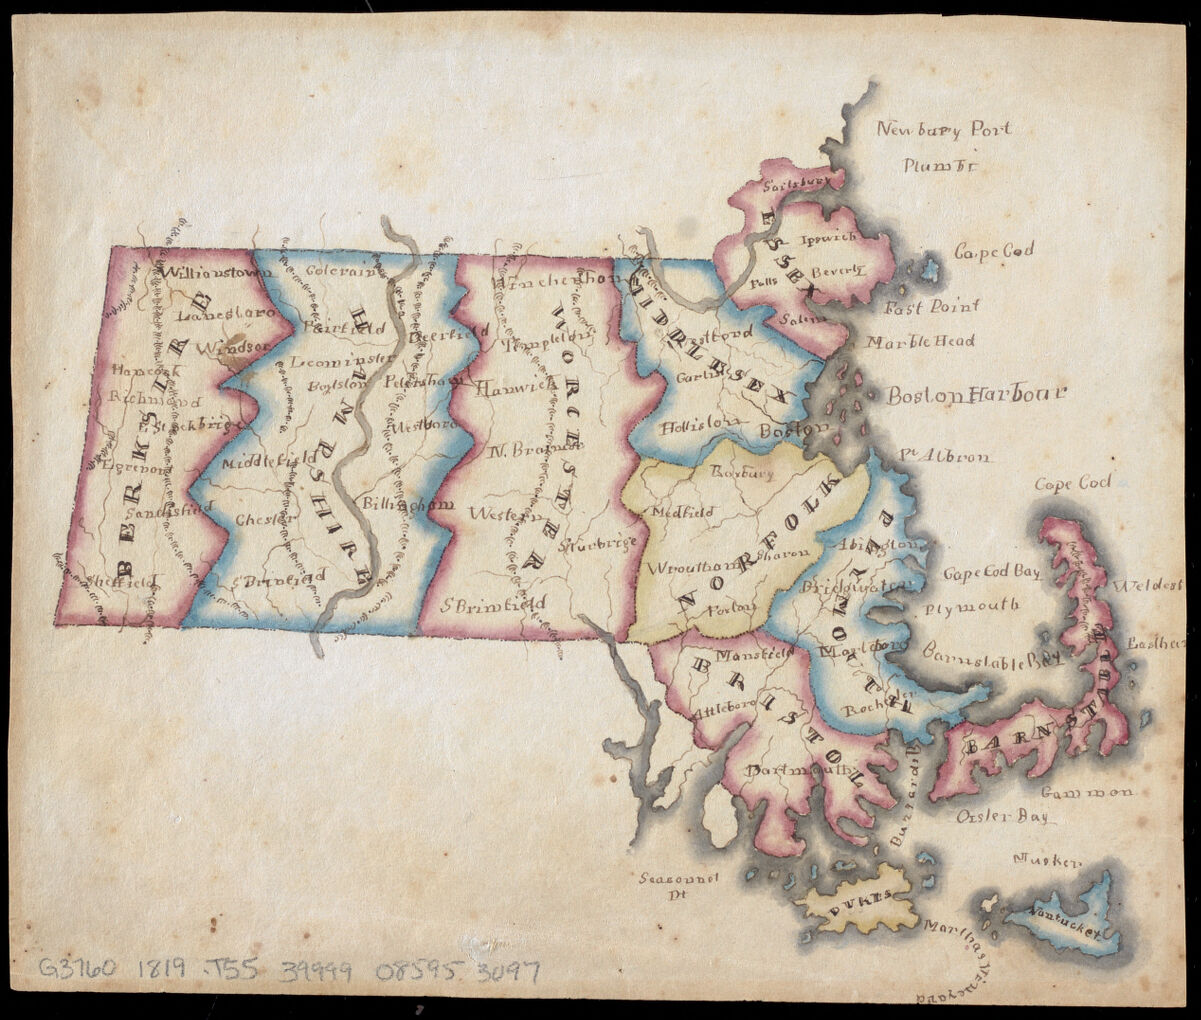
During the late 18th and early 19th century, it was common practice for American female students attending private academies to prepare maps of various parts of the world by copying maps from books or atlases. Most often, girls were taught by female instructors, who drew maps themselves to demonstrate geographic, artistic and design skills to their pupils. This map of Massachusetts was done using ink and watercolor by a schoolgirl, Eliza Tileston and was possibly gifted to a friend, as the message “To Clara” is written on verso in lower left.
Mary B. Hotz, Historical map of Watertown, 1630-1930 (1930)

Mary Hotz designed this map as a high school student in 1930, for a poster contest celebrating the 300th anniversary of Watertown, Massachusetts. Her map of historical Watertown, complete with Native Americans, houses, churches, arsenals, courthouses, taverns, mills, schools and statues was the winning entry. Hotz combined recent and past history in this colorful and detailed map, which she shared with local community clubs, and President Calvin Coolidge, who had family ties to the town. She eventually attended art school in Boston, but never practiced professionally; however, her map appeared in official buildings and private residences throughout Watertown for years.
Agnes Sinclair Holbrook, “Nationalities Map No. 1,” from Hull-House Maps and Papers … (1895)
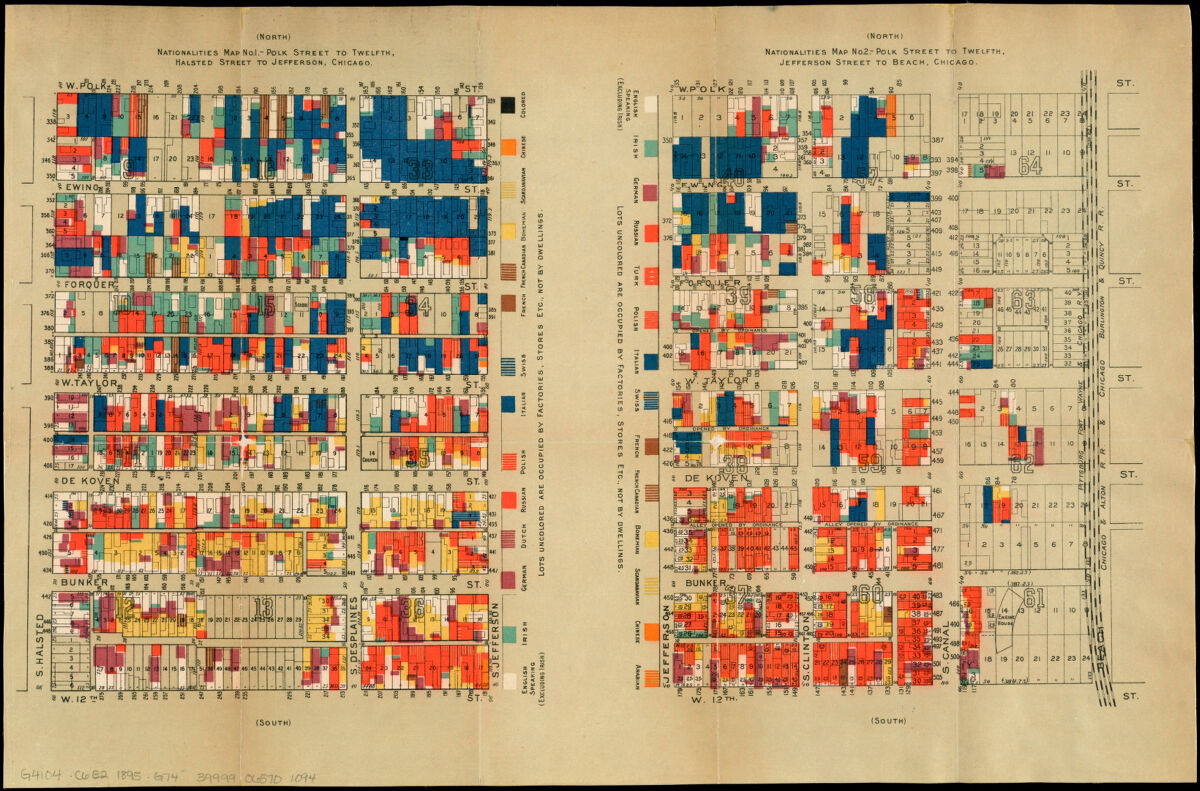
Designed by Agnes Sinclair Holbrook, a Wellesley College graduate and resident of Chicago’s Hull-House, this thematic map of the neighborhood east of the House illustrates the immigrant population living in the area. A female-based social settlement in Chicago’s Near West Side, Jane Addams founded the settlement house in 1889, offering newcomers childcare as well as classes in English and civics. Hull-House played an important role in social reforms of the late 19th-century, and its residents were responsible for transcribing, interpreting and mapping statistical data for the map displayed here. Part of a set of four, the map is heavily influenced by earlier statistical mapping by Charles Booth’s wage maps of London, first published in 1889. This statistical cartographic presentation foreshadows GIS mapping – using color and statistics to present social facts.
Mildred Giddings Burrage, The attack on Bunker Hill in the peninsula of Charlestown the 17th of June 1775 (1926)

Maine-based artist Mildred Burrage created many paintings and drawings throughout her career, which began in the early 20th-century. Burrage studied art in both America and Europe, and created numerous impressionist works while staying in France. In the 1920s, she executed several relief-paintings based on historic maps, prints, engravings and photographs. The gesso relief painting displayed here is similar to a vignette illustrated in Sayer and Bennett’s 1775 map “The Seat of War in New England.” Here Burrage has enlarged the battle scene, and used a gesso (white paint mixture) build-up to show relief. She added gold leaf to the piece for added decorative flare.
Marie Catherine Haussard (engraver), Partie de l’Amérique septent? qui comprend la Nouvelle France ou le Canada (1755)

This hand-colored map of the Canadian north features a cartouche engraved and signed by C. (Catherine) Haussard. Marie Catherine and her sister Elizabeth were 18th-century Parisian engravers who specialized in the creation of cartouches – the decorative and informative label identifying a map, its author and the subject. The sisters were daughters of noted French engraver Jean-Baptiste Haussard, who trained them in the art of engraving. The cartouche shown here incorporates popular 18th-century symbols of North America – pine trees, a beaver, and a Native American canoe.
Toy Lasker, New York in Maps: An Instant Guide to Every Place in Town (1970)
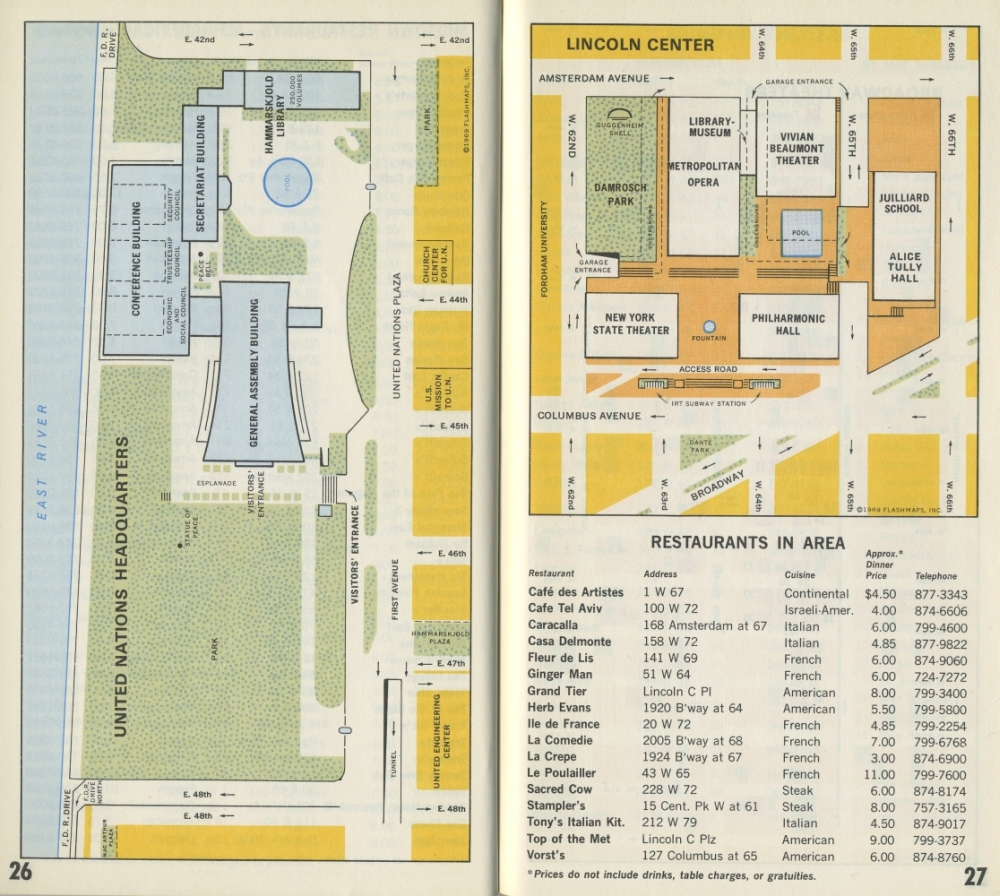
Toy Lasker was the founder and publisher of Flashmaps, Inc., a company that created thematic maps and guidebooks which focused on topics of interest to residents, tourists and the business community. She produced 3 million maps of various major cities and popular tourist destinations before selling the company to Random House in 1987. Lasker conceived and designed the maps displayed here in 1967, partnering with New York Magazine to create this cartographic key to Manhattan art galleries, museums, restaurants, parks, theatres, shops and transportation. These popular maps were used decades ago similar to how smartphones are used today to navigate cities – helping visitors locate their places of interest.
Green Map System; Wendy E. Brawer, Powerful Green Map NYC: Charting the Energy in New York’s Environment (2006)
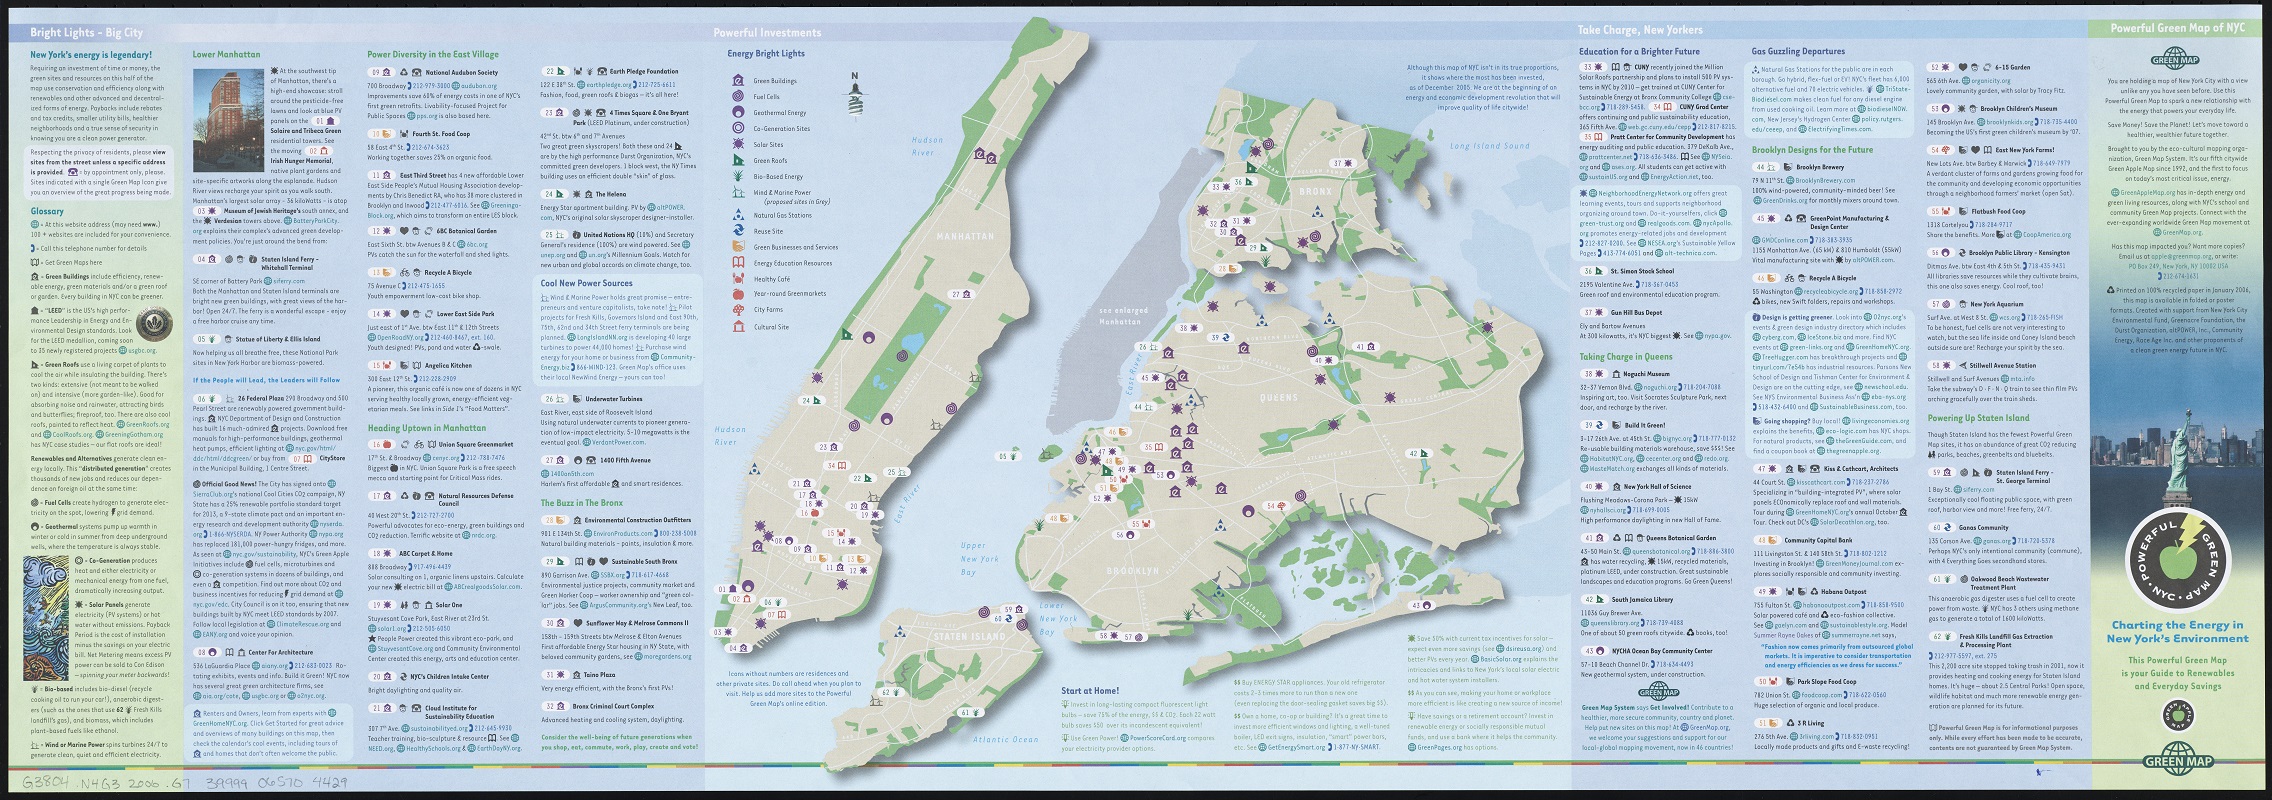
The Green Map System based in New York City and founded by Wendy Brawer, has for decades focused on the environment, sustainability and culture, in an effort to create a healthier and greener place to live. Green Map NYC calls on city residents using GIS technology to create maps of their neighborhoods reflecting issues that are important to them. Thematic maps created from statistical data, such as the energy-use map displayed here, help visualize the impact of an urban way of living on the natural environment. Created after the New York City blackout in 2003, this map was intended to raise awareness of energy consumption and conservation.
Sarah Bell, Denali Peak (2022?)
Created by notable modern cartographer, Sarah Bell, this map depicts Denali, the highest peak in North America at 20,310 feet (6,190 m). It was named by the Koyukon people centuries ago, and means ‘Great One.’ The mountain is popular among climbers and mountaineers and Denali National Park is centered on this great mountain. So far in her career as a cartographer and data visualization specialist, Bell has done work for the U.S. Forest Service, the National Park Service, Western Washington University’s Resilience Institute, as well as a number of private institutions.
Meghan Kelly, Current Reservations and Tribal Lands (2018)
Created to orient students to their “Native neighbors” by showcasing the local tribal lands and nations of Wisconsin, Meghan Kelly designed this map with the input and partnership from a number of tribal and state organizations. Intended for classroom use, this map gracefully distills vast amounts of tribal history and complex boundaries to a tool everyone from children to adults can navigate.
Meghan Kelly is the Center’s next Designer-In-Residence and will spend time this June working with the LMEC collections, producing original material in collaboration with Center staff, and working on her own independent creative cartographic projects.
Our articles are always free
You’ll never hit a paywall or be asked to subscribe to read our free articles. No matter who you are, our articles are free to read—in class, at home, on the train, or wherever you like. In fact, you can even reuse them under a Creative Commons CC BY-ND 2.0 license.