On September 27, we hosted From The Vault: Behind the Scenes of Processing Place.
Consisting of early GIS maps of Massachusetts, alongside other cartographic objects that helped give insight into the early relationships of computers and cartographers, this From the Vault focused on objects that give a window into the early period of computer cartography, but that didn’t quite make the cut for our current gallery exhibition. Impressed by what you see here? Be sure to see the objects that did make the cut in our current exhibition, Processing Place, in the Leventhal Map & Education Center gallery.
MassGIS Views of Cape Ann (1990)

This map is an early example of maps made using corporate mapping software, Arc/INFO, and printed with electrostatic printers. In the center table in the gallery, you can see a sample color swatch diagram that would have been used to pick colors for maps like this. Particularly notable in this map are the “3D”-looking representations of elevation data, which were based on federal datasets such as digital line graph (DLG) and digital elevation model (DEM), and were a hallmark feature of Arc/INFO that allowed for visual representations of surfaces.
Applied Geographics, Inc. Massachusetts coastal towns [ca. 1990-1999]
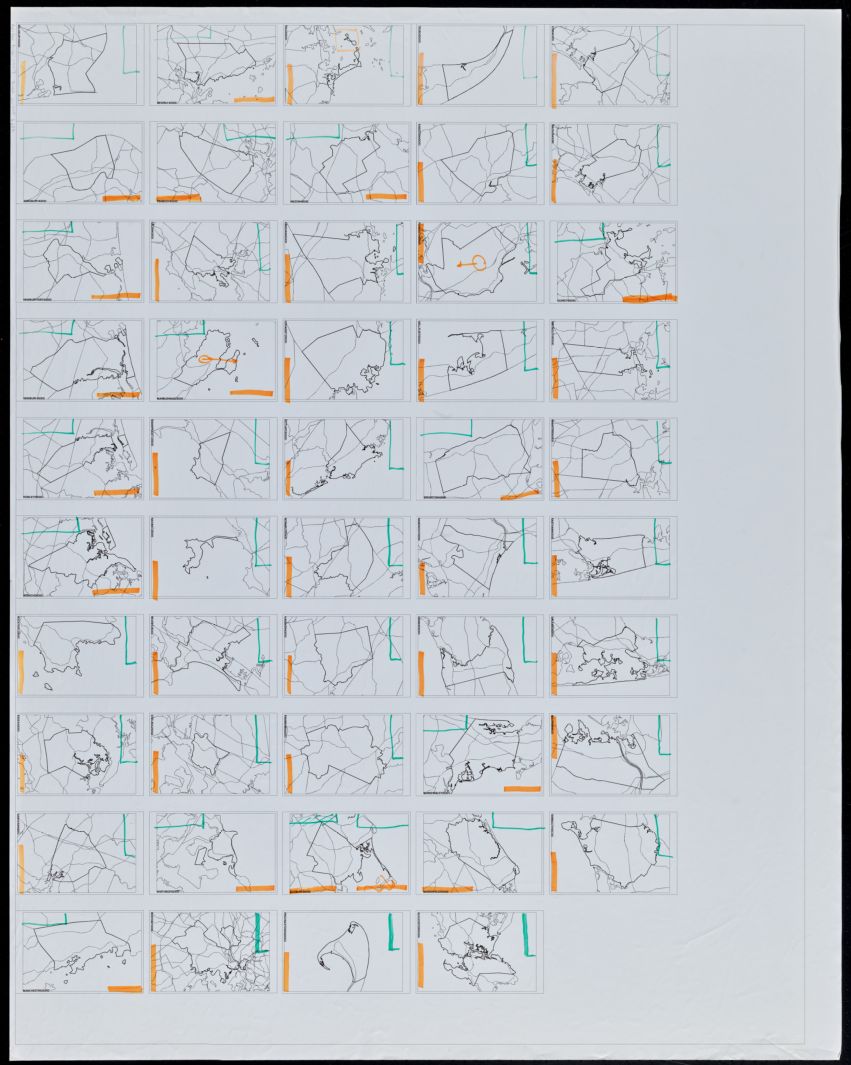
This page is a print-out of an important step in mapmaking, which is laying out the important informative elements of a map (title block, credits, north arrow, scale bar, etc.) so that they don’t interfere with the content of the map. Computerized map production meant it was trivial to create visualizations of the same dataset for different locations, seen here with the same types of information displayed for various coastal towns of Massachusetts. This page only shows the outlines of the towns and the orange and green marks show an unnamed editor's ideas for where the title block and credits, respectively, could be located for each map.
MassGIS Mashpee land use change 1971-1990 (1991)
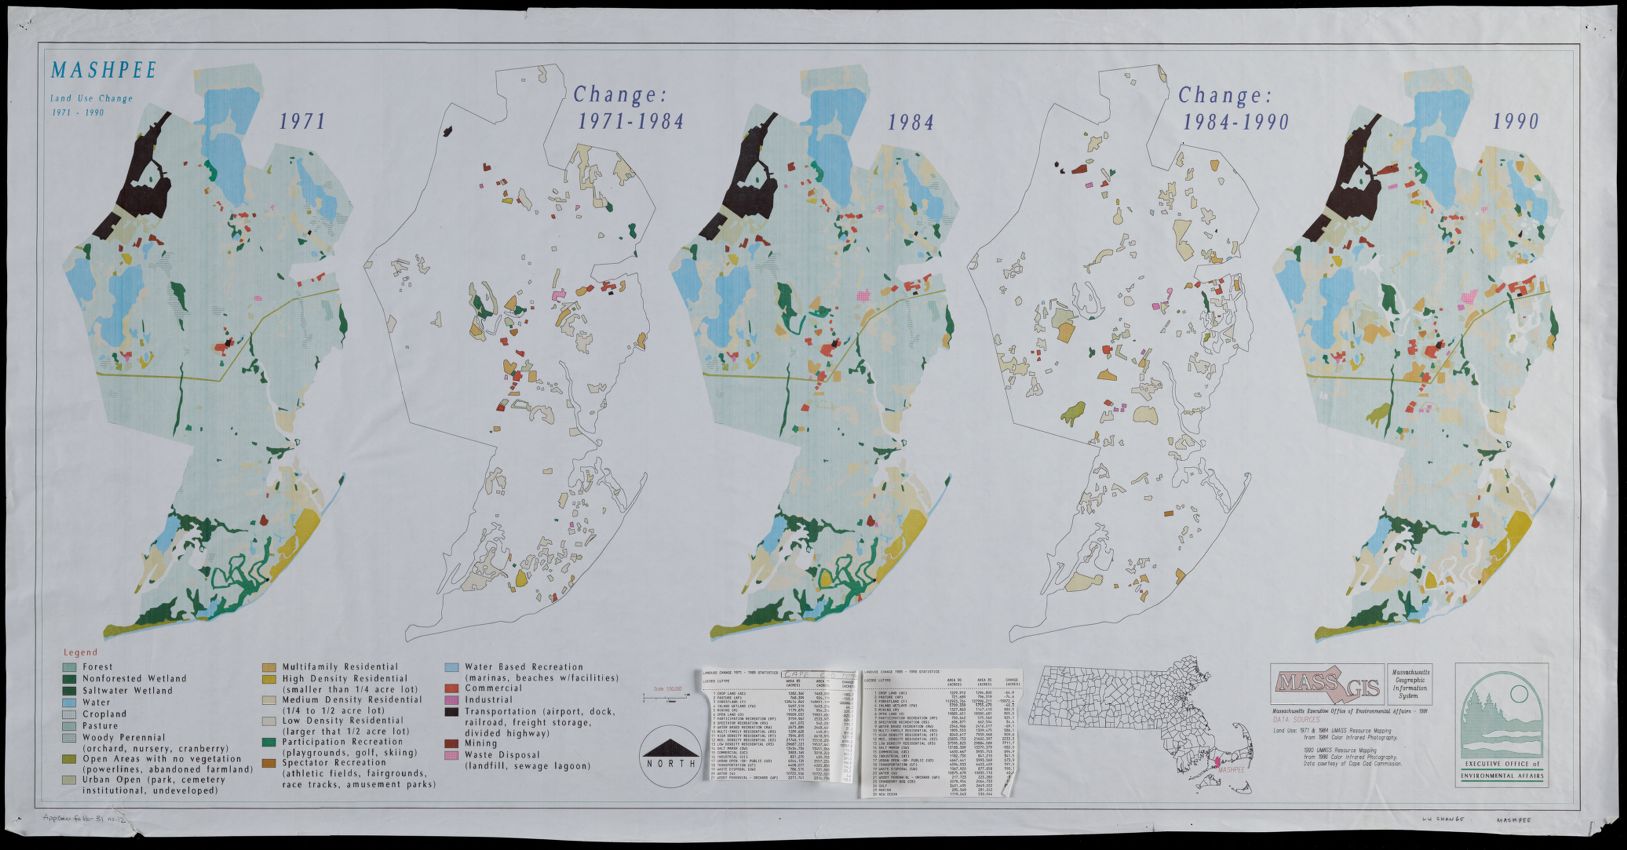
This map shows the ways that land use changed over two decades in the Massachusetts town of Mashpee. As with other maps of this time period, the map is in many ways secondary in importance to the data table of land use statistics printed on the bottom of the sheet. One notable part of this map is that the cartographers took time to create two “Change” views that can visually help guide a viewer towards an understanding of the difference between two moments in time.
MassGIS The Appalachian trail in Massachusetts (1991)
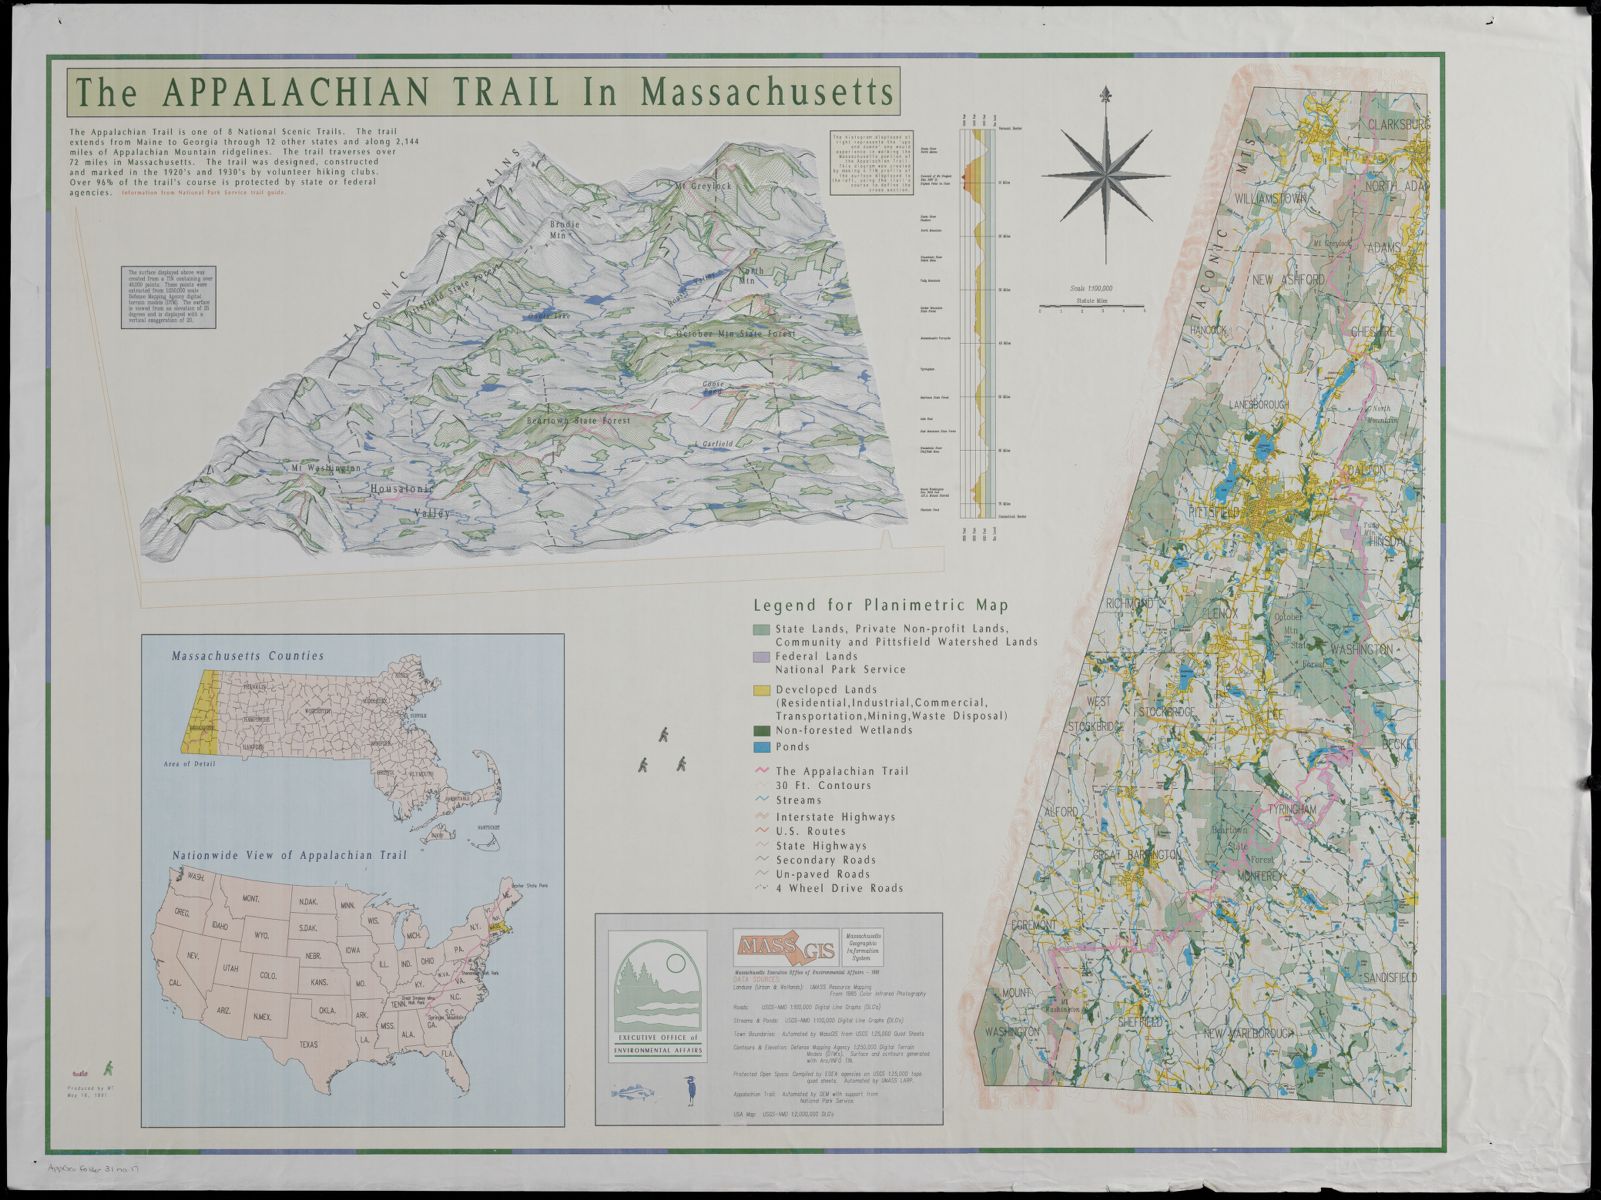
This map is an incredibly sophisticated example of the complicated layouts and visualizations that could be achieved using the mapmaking softwares of the early 1990s. What is noteworthy from our perspective, however, is how the cartographer (noted as “MT” in the bottom left hand corner) left his humorous mark on the piece. “MT” is Mike Terner, a former employee of Applied Geographics, Inc., which was contracted by MassGIS to make maps throughout the 1990s and Mike left small linework visualizations of hikers scattered across the page — a creative way to add visual interest while working within the confines of printing technology at the time.
Geological Survey (U.S.). National Mapping Division Index to 1:24,000-scale digital line graph (DLG) and digital elevation model (DEM) data (1995)

This map was created as a reference poster for folks working with federal spatial data and would have been useful to discover what kinds of datasets existed for places across the United States. In the map, the country has been divided into a large grid and each “cell” (or individual rectangle) of the grid has symbols that show what kinds of datasets were completed (red background with black symbols) or in progress (white background with green symbols) for each part of the country. Visualizations of digital elevation models can be seen in Views of Cape Ann and The Appalachian trail in Massachusetts.
MassGIS GIS mapping of risk factors for eastern equine encephalitis (1991)

This set of maps was created in 1991 as the State of Massachusetts faced increased risk of eastern equine encephalitis (Triple E virus) spreading, with each map showing a different variable for the same geographic extent. Public health applications are still one of the most common uses for making maps using computers. Earlier tin 2024, this same virus was making headlines for confirmed cases in the state!
MassGIS Digital orthography checkplots (2000)
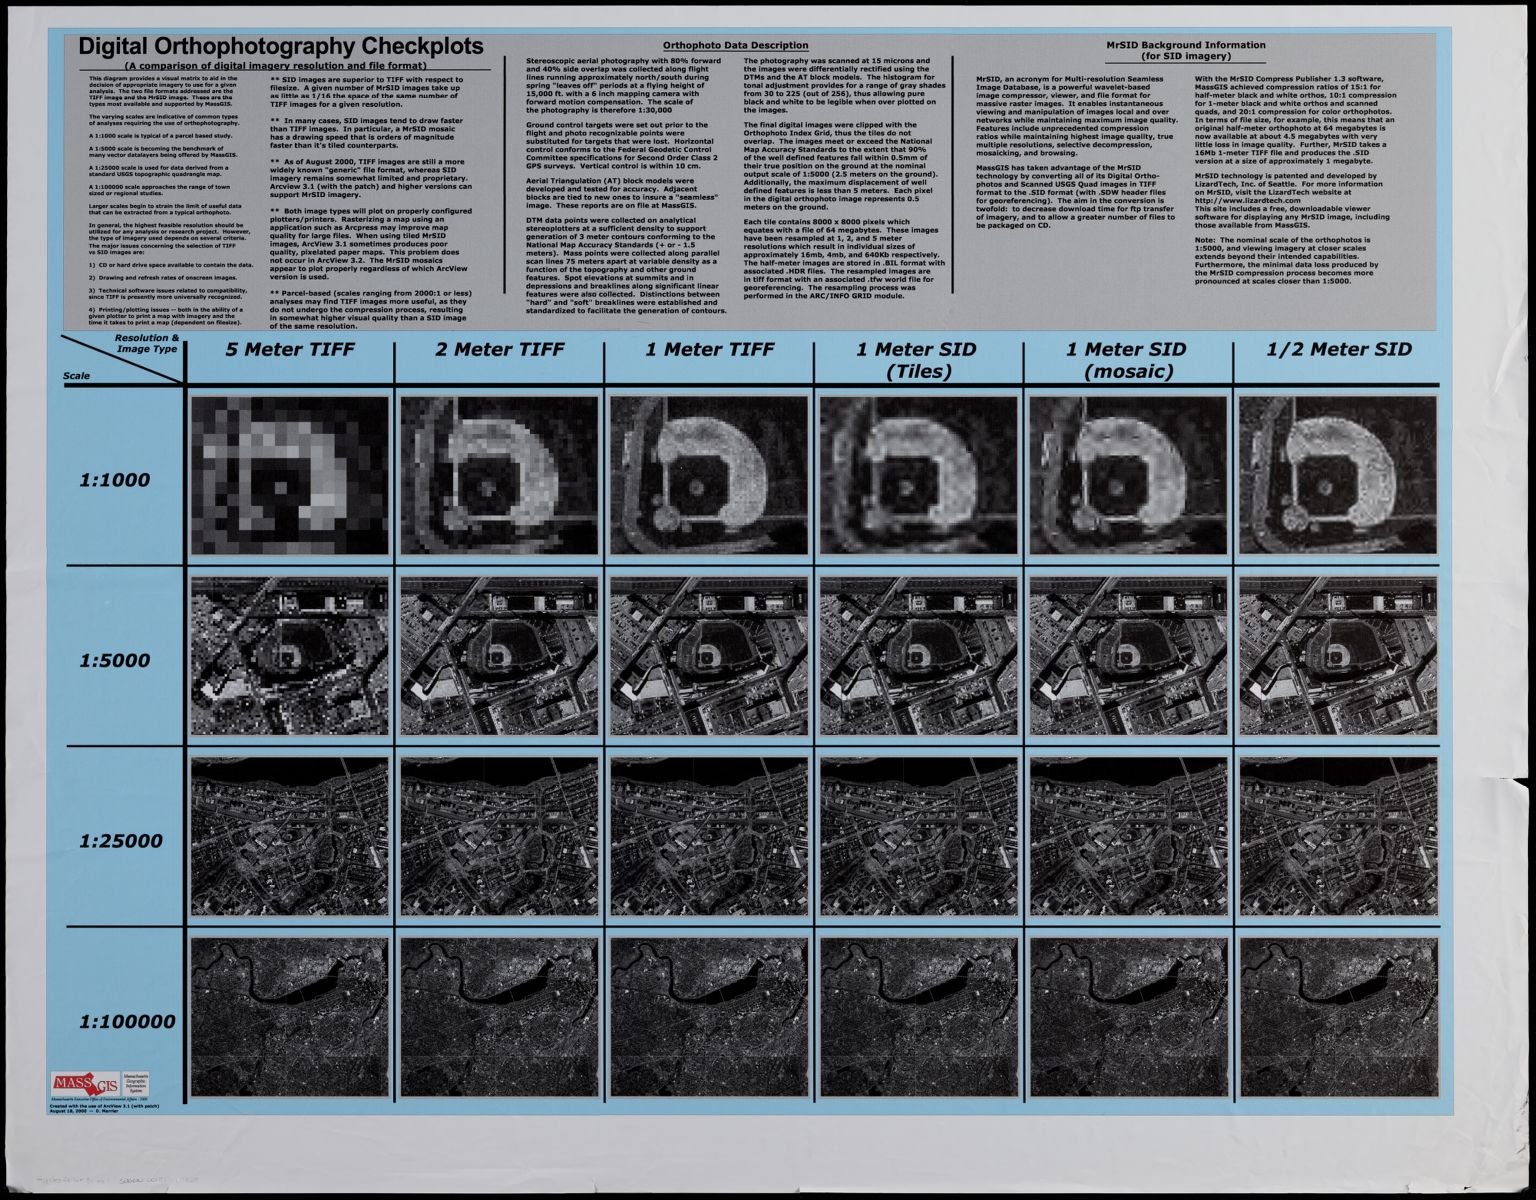
This graphic is a helpful visual to understand the different resolutions of aerial imagery and which scales are most useful for different planning and land use studies. It’s important to note that when this poster was produced, the standard form of imagery like this would have been aerial imagery that was produced through dozens of hours of plane flights across the state of Massachusetts. Today, this method of creating land use imagery is still used, but is now also augmented by the increasing availability of satellite imagery.
MassGIS EOEA MassGIS geographic information system transition document (1990)
This document was produced by Applied Geographics, Inc. as a tool for MassGIS to be able to bridge a technology transition to primarily computer-led workflows for making maps across the agency. This document is a collection of visualizations of statewide datasets that can be used in different contexts and examples of maps made for different specific applications. Of particular interest are the descriptions and definitions listed above that give administrative context for why this document was created.
Our articles are always free
You’ll never hit a paywall or be asked to subscribe to read our free articles. No matter who you are, our articles are free to read—in class, at home, on the train, or wherever you like. In fact, you can even reuse them under a Creative Commons CC BY-ND 2.0 license.